Prometheus Integration
This feature is only available in Incredibuild's Enterprise Plan.
Prometheus is a free, open source tool to help collect and visualize data. It integrates with many other tools that provide additional visualization tools as well. Incredibuild integrates with Prometheus by allowing you to send Incredibuild data to Prometheus to collect and view Incredibuild data.
Once enabled, Incredibuild automatically exports data that Prometheus can pull every few seconds.
Note: If you disable the integration or changes the port, all metrics will be reset.
Configuring the Integration
-
If you have not already done so, install Prometheus on any machine in your Incredibuild environment.
-
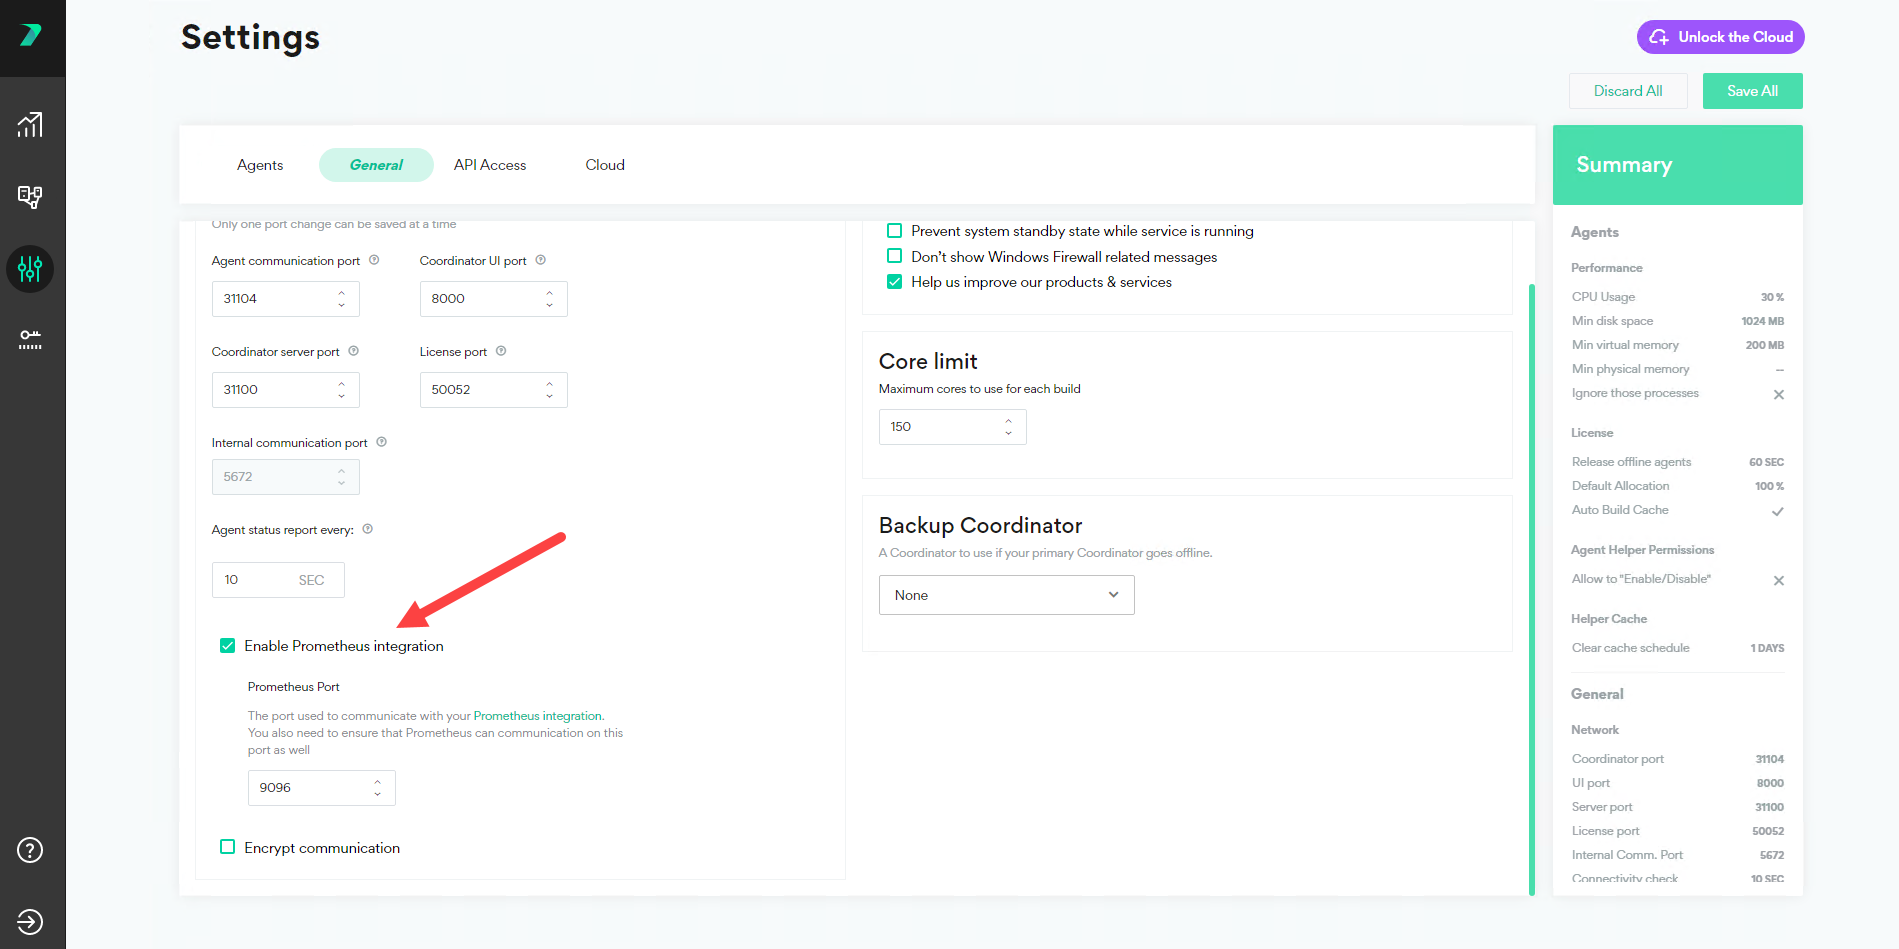
In the Coordinator Manager > Settings > General check the Enable Prometheus Integration checkbox. If you do not see this option, make sure you are using an Enterprise level Incredibuild license.
-
Enter the port that will be used to manage communication between Incredibuild and Prometheus. This port must be open on both sides.
-
On the machine that contains Prometheus, in the main Prometheus directory, open the prometheus.yml file.
-
Below the section that contains job_name="prometheus", add the following code. Replace <IB Coordinator Machine IP or name> and <prometheus port> with the hostname of the machine that contains your Incredibuild Coordinator and the port you defined above. If this is the same machine as Prometheus, you can use "localhost" instead.
Copy- job_name: "IB_coordinator"
static_configs:
- targets: ["<Incredibuild Coordinator Machine IP or name>:<prometheus port>"]
For example:
Copy# my global config
global:
scrape_interval: 15s # Set the scrape interval to every 15 seconds. Default is every 1 minute.
evaluation_interval: 15s # Evaluate rules every 15 seconds. The default is every 1 minute.
# scrape_timeout is set to the global default (10s).
scrape_configs:
# The job name is added as a label `job=<job_name>` to any timeseries scraped from this config.
- job_name: "prometheus"
# metrics_path defaults to '/metrics'
# scheme defaults to 'http'.
static_configs:
- targets: ["localhost:9090"]
- job_name: "incredibuild"
# metrics_path defaults to '/metrics'
# scheme defaults to 'http'.
static_configs:
- targets: ["localhost:9096"]
] -
If it isn't started, start the Prometheus service. For details, see the Prometheus Documentation.
-
To verify that the integration has been configured, open Prometheus and verify that the Incredibuild metrics exist in the search results.
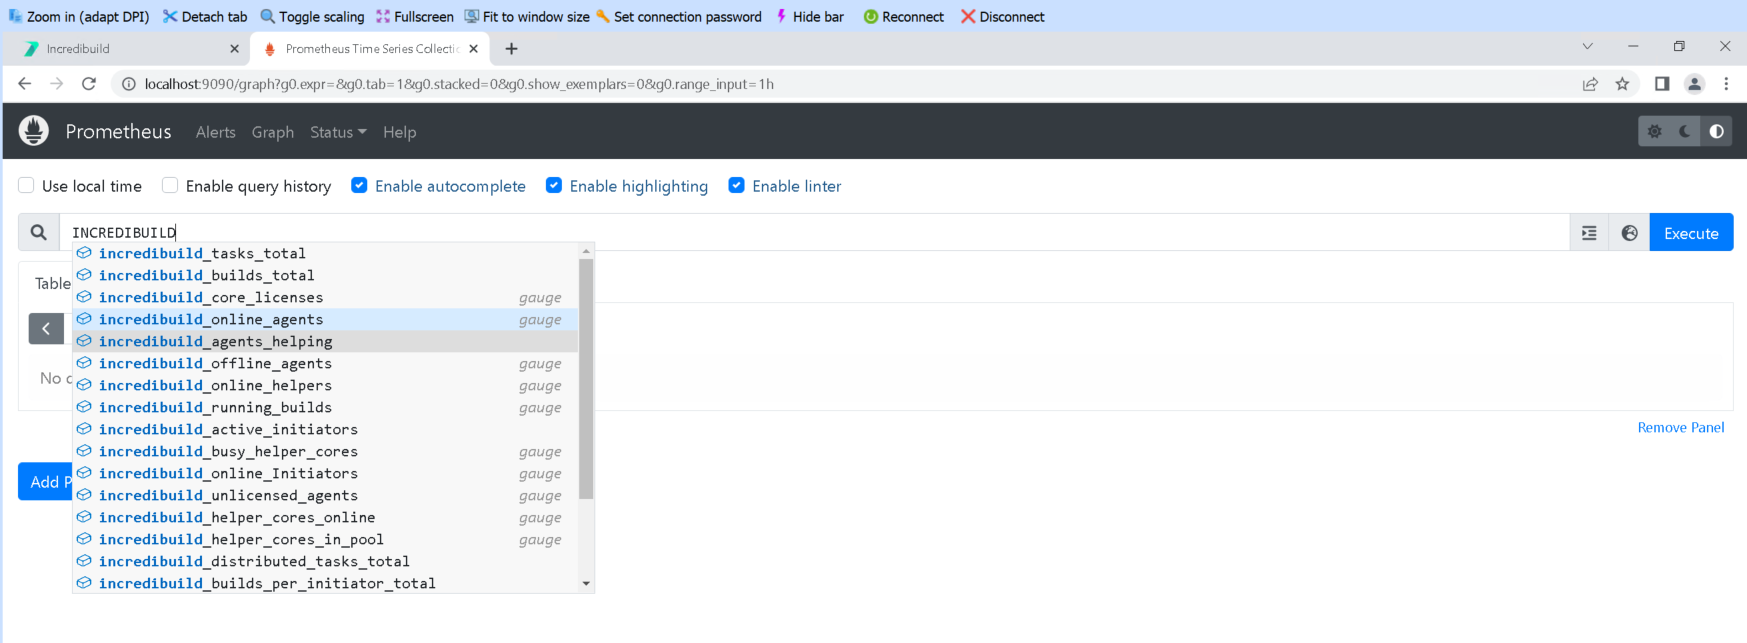


The integration is configured, but no data is sent until a build is run. Note that the data for the first few builds may look a bit unusual in Prometheus and Grafana due to the way their queries are calculated.
Viewing Data in Prometheus Graphs
You can use queries to create graphs in Prometheus based on the Incredibuild metrics. These queries assume that the job label defined in the prometheus.yml file is called "IB_coordinator".
Note that the data for the first few builds may look a bit unusual in Prometheus and Grafana due to the way their queries are calculated.
Number of builds per hour per Build Group
sum by (build_group) (rate(incredibuild_builds_total{job="IB_coordinator"} [1h])) * 60 * 60
Number of builds per day broken down by build status (ended successfully or not)
sum by (ended_successfully) (rate(incredibuild_builds_total{job="IB_coordinator"} [1d])) *24 * 60 * 60
Number of unsuccessful builds per day broken down by Build Group
sum by (build_group) (rate(incredibuild_builds_total{job="IB_coordinator", ended_successfully="failure" }[1d])) * 60 * 60 * 24
Number of successful builds per day broken down by Build Group
sum by (build_group) (rate(incredibuild_builds_total{job="IB_coordinator", ended_successfully="success" }[1d])) * 60 * 60 * 24
Number of builds per hour
sum(rate(incredibuild_builds_total{job="IB_coordinator"}[1h]) * 60 * 60)
Current busy Helper Cores per Build Group
sum by (build_group)(incredibuild_busy_helper_cores{job="IB_coordinator"})
Current Helper Cores in the Pool per Build Group
sum by (build_group)(incredibuild_helper_cores_in_pool{job="IB_coordinator"})
Current Licensed Helper Cores
sum by (coord_name)(incredibuild_core_licenses{job="IB_coordinator"})
Build duration histogram broken down by Build Group
histogram_quantile(0.5, sum by(le, build_group) (rate(incredibuild_builds_seconds_histogram_bucket{job="IB_coordinator"}[1d])))
Average build duration per day
rate (incredibuild_builds_seconds_histogram_sum{job="IB_coordinator"}[1d]) / rate(incredibuild_builds_seconds_histogram_count{job="IB_coordinator"}[1d])
Viewing Data in Grafana Dashboards
Prometheus can integrate with Grafana to display the data in dashboards. To integrate Incredibuild and Prometheus with Grafana, see this article. When you create a Data Source, make sure the name is Prometheus (that is the default).
You can download our sample JSON dashboards and import them directly into Grafana to view data about the number of concurrent builds, helper cores, build duration, and number of builds per day.
To import JSON dashboards into grafana, see the Grafana documentation.
Data Included in the Integration
| Data | Metric Type | Metric Name | Labels (details in table below) | Notes |
|---|---|---|---|---|
| Total number of completed builds |
Counter |
incredibuild_builds_total | coord_name, build_group, initiator_type, ended_successfully |
This includes builds that failed as well as those that completed successfully. |
| Total number of builds broken down by initiator |
Counter |
incredibuild_builds_per_initiator_total | initiator_name, ended_successfully |
|
| Total run time (seconds) of all successful builds |
Counter |
incredibuild_successful_builds_seconds_total | coord_name, build_group, initiator_type, distributed_to_helpers |
|
| Total number of executed tasks |
Counter |
incredibuild_tasks_total | coord_name, build_group, initiator_type, distributed_to_helpers |
|
| Total number of tasks distributed to a helper |
Counter |
incredibuild_distributed_tasks_total | coord_name, build_group, initiator_type |
|
| The number of Initiators currently initiating a build |
Gauge |
incredibuild_active_initiators | coord_name, build_group, initiator_type |
|
|
The number of builds currently running |
Gauge |
incredibuild_running_builds |
coord_name, build_group, initiator_type |
|
|
The number of helper cores that are currently busy |
Gauge |
incredibuild_busy_helper_cores |
coord_name, build_group, helper_type |
|
|
The number of helper core licenses in your account |
Gauge |
incredibuild_core_licenses |
coord_name |
Includes both fixed and floating |
|
The number of helper cores that currently have been assigned a fixed or floating license |
Gauge |
incredibuild_helper_cores_in_pool |
coord_name, build_group |
|
|
The number of helper cores currently online |
Gauge |
incredibuild_helper_cores_online |
coord_name, build_group |
Only includes helpers that are enabled as helpers, online, and have a license. |
|
The total number of successful builds broken down in a histogram |
Histogram |
incredibuild_builds_seconds_histogram |
coord_name, build, build_group |
Broken down into 0-1 seconds, up to 10 seconds, up to 60 seconds, up to 30060-300, 301-600, 601-1200, 1201-1800. |
|
The number of helper agents currently helping in a build |
Gauge |
incredibuild_agents_helping |
coord_name, build_group, helper_type |
Does not include helper agents assisting initiators on the same machine. |
|
The current number of disabled helper cores with a license |
Gauge |
incredibuild_disabled_helpers_with_license |
coord_name, build_group |
|
|
The number of agents currently online |
Gauge |
incredibuild_online_agents |
coord_name, build_group |
Includes helper and initiator agents |
|
The number of agents currently offline |
Gauge |
incredibuild_offline_agents |
coord_name, build_group |
Includes helper and initiator agents |
|
The number of agents without any license |
Gauge |
incredibuild_unlicensed_agents |
coord_name, build_group |
Agents without initiator or helper license (called local in UI) |
|
The number of helper agents currently online |
Gauge |
incredibuild_online_helpers |
coord_name, build_group |
Only includes helpers that are enabled as helpers, online, and have a license. |
|
The number of initiator agents currently online |
Gauge |
incredibuild_online_initiators |
coord_name, build_group |
|
|
The number of helper cores currently needed across your grid |
Gauge |
incredibuild_needed_helpers |
coord_name, build_group |
Only includes helper cores that meet all requirements to act as helpers (includes both helper cores currently helping and those who are ready to be assigned to help) |
|
The number of helpers currently available across your grid |
Gauge |
incredibuild_available_helpers |
coord_name, build_group |
|
Label Details
| Label Name | Description |
|---|---|
|
coord_name |
The machine ID of your Coordinator. |
| build_group | The name of the build group. |
| initiator_type | The type of Initiator machine: CI, developer, or none. |
| ended_successfully | True if the build completed successfully, false if it did not. |
| distributed_to_helpers | True is some tasks were distributed to helper agents, false if they were not. |
| helper_type | The type of helper machine: cloud or on-prem |