> ## Documentation Index
> Fetch the complete documentation index at: https://docs.incredibuild.com/llms.txt
> Use this file to discover all available pages before exploring further.
# Builds
> Browse your build history and drill into any build in the Incredibuild Console.
The **Builds** page shows every build across your environment - self-hosted grids, hosted runners,
and CI pipelines. Open any build to see its analyzed build flow: task execution, cache efficiency,
and time distribution.
 ## Build details & visibility
Available only for grids running Incredibuild **10.35.0** or later.
Click a build to open its details panel.
## Build details & visibility
Available only for grids running Incredibuild **10.35.0** or later.
Click a build to open its details panel.
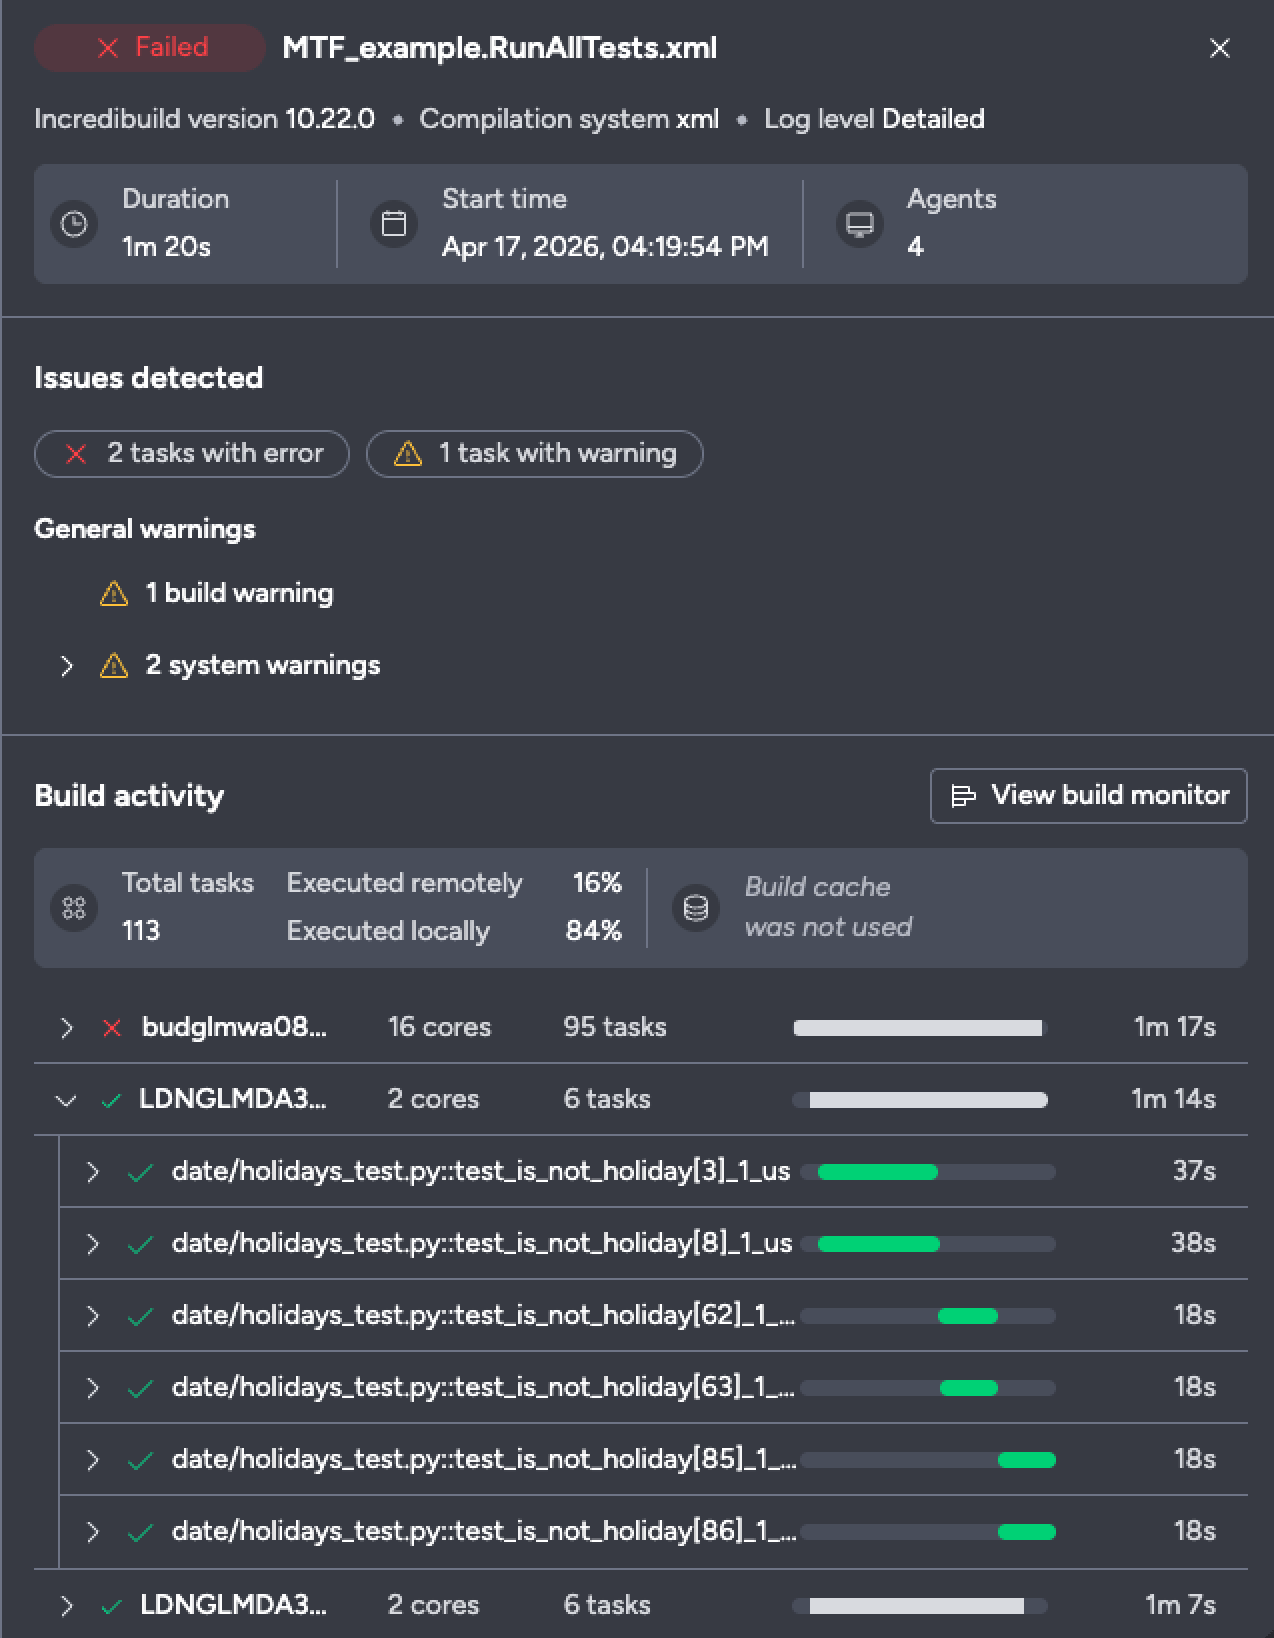 ### Issues detected
Drill down into your build's errors and warnings and quickly identify failing tasks and their failure reason.
### Build activity
A per-agent task breakdown with cache stats: **Total tasks**, **Executed remotely** vs. **Executed
locally**, and cache hits vs. misses.
* **Machines and tasks** - each machine row shows its **cores** and **tasks** count; expand a machine
to see which tasks run on it.
### Build visibility
Click **View build monitor** for a full-screen timeline of the build - every machine and task laid out
over time, so you can see how work was distributed and where the time went.
### Issues detected
Drill down into your build's errors and warnings and quickly identify failing tasks and their failure reason.
### Build activity
A per-agent task breakdown with cache stats: **Total tasks**, **Executed remotely** vs. **Executed
locally**, and cache hits vs. misses.
* **Machines and tasks** - each machine row shows its **cores** and **tasks** count; expand a machine
to see which tasks run on it.
### Build visibility
Click **View build monitor** for a full-screen timeline of the build - every machine and task laid out
over time, so you can see how work was distributed and where the time went.
 Get a full breakdown of your distributed build - every machine and task, laid out on the timeline.
* **Color legend** - **Distributable** (green), **Non-distributable** (blue), **Failed** (red), and
**Warning** (yellow).
Get a full breakdown of your distributed build - every machine and task, laid out on the timeline.
* **Color legend** - **Distributable** (green), **Non-distributable** (blue), **Failed** (red), and
**Warning** (yellow).