Build List
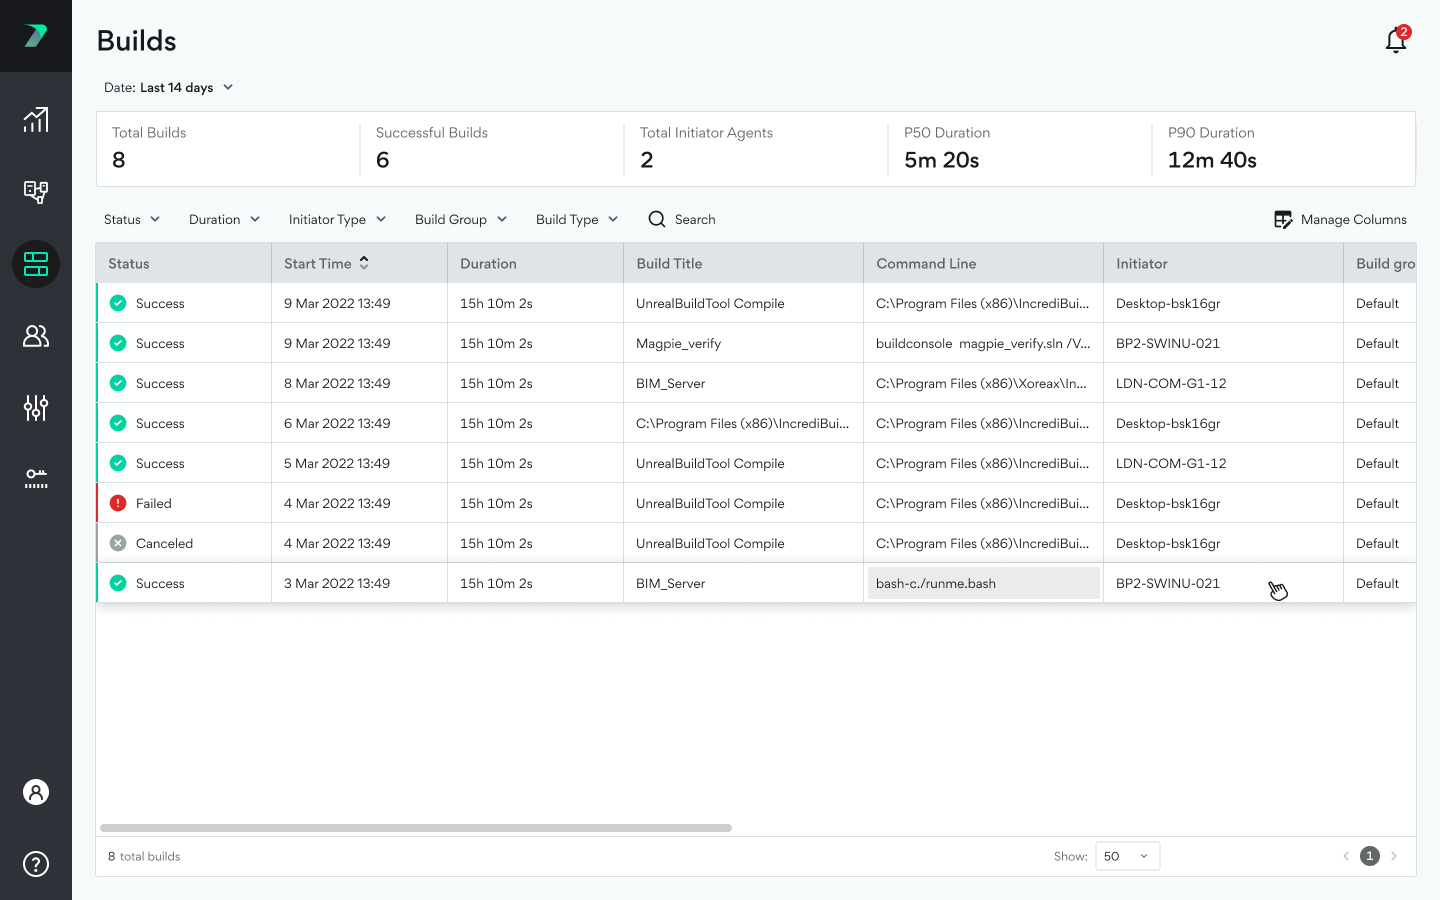
The Build List allows you to view recent builds and their details. You can filter the list by date at the top of the page. The build list stores the latest 200,000 builds are available regardless of how long ago they were run.
Time Zones
The times displayed are from the perspective of the viewer's browser. This means that the times will look different depending on who is viewing the data.
Overview Bar
The overview contains a summary of your builds during the selected time period and includes:
-
Total Builds: The total number of builds that were run.
-
Successful Builds: The total number of builds that were successfully run.
-
Total Initiator Agents: The number of unique Initiator Agents that initiated at least one of the build.
-
p50 Duration: The mean duration of your builds. 50 percent of builds were longer, and 50 percent of builds were shorter than this value.
-
p90 Duration: The duration of the build that is the 90th percentile in terms of duration. 90 percent of builds were shorter, and 10 percent of builds were longer that this value.
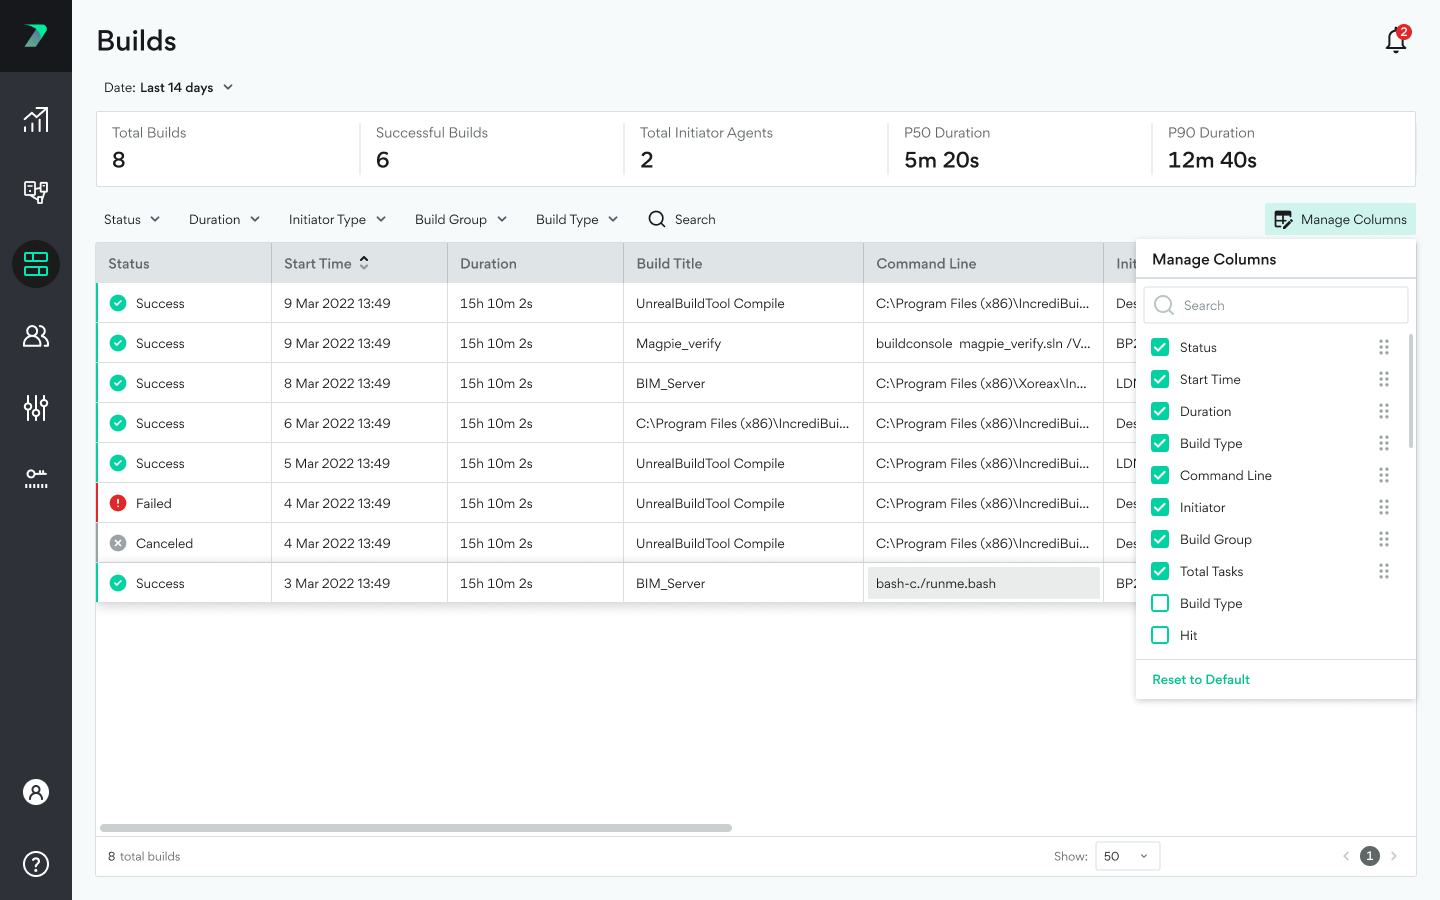
Manage Columns
You can modify the columns using the Manage Columns button. Changes take effect immediately after checking or unchecking the boxes.
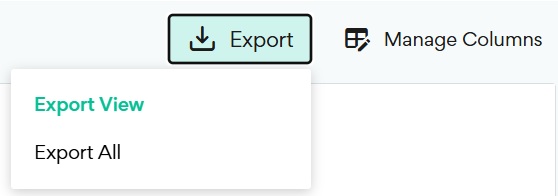
Export
You can export the build list using the Export button. You can either click Export View to export the visible columns, or Export All to export all the columns.
Build List
You can filter the build list by status, type, duration, or Build Group. You can also filter by searching the list for strings in the Build Title, Initiator, and Command Line values of your builds. The list contains the following columns:
-
Status: Whether the build was completed with a status of Success, Failed, or Canceled.
-
Build Caption: If you included a title in your build command to help identify the build, you can view it here.
-
Command Line: The command that was used to run the build.
-
Initiator: The name of the initiator that initiated the build.
-
Build Group: The Build Group that the initiator belongs to.
-
Start Time: The start time of the build.
-
Duration: The duration of the build.
-
Failure Reason: If relevant, the reason the build failed.
-
Total Tasks: The total number of tasks in the build.
-
Remote Tasks: The number of tasks that were executed by an on-prem remote helper agent.
-
Cloud Tasks: The number of tasks that were executed by a cloud helper agent.
-
Local Tasks: The number of tasks that were executed on the local machine.
-
Max. Helper Cores: The maximum number of helper cores used at one time.
-
Average Helper Cores: The average number of helper cores used at one time.
-
Max Needed Helper Cores: The maximum demand for helper cores at one time.
-
Agent Description: A description of the Initiator Agent.