Build Monitor Graphical View
You can view the build output in graphical view by clicking the Graphical View tab in the Build Monitor tab.
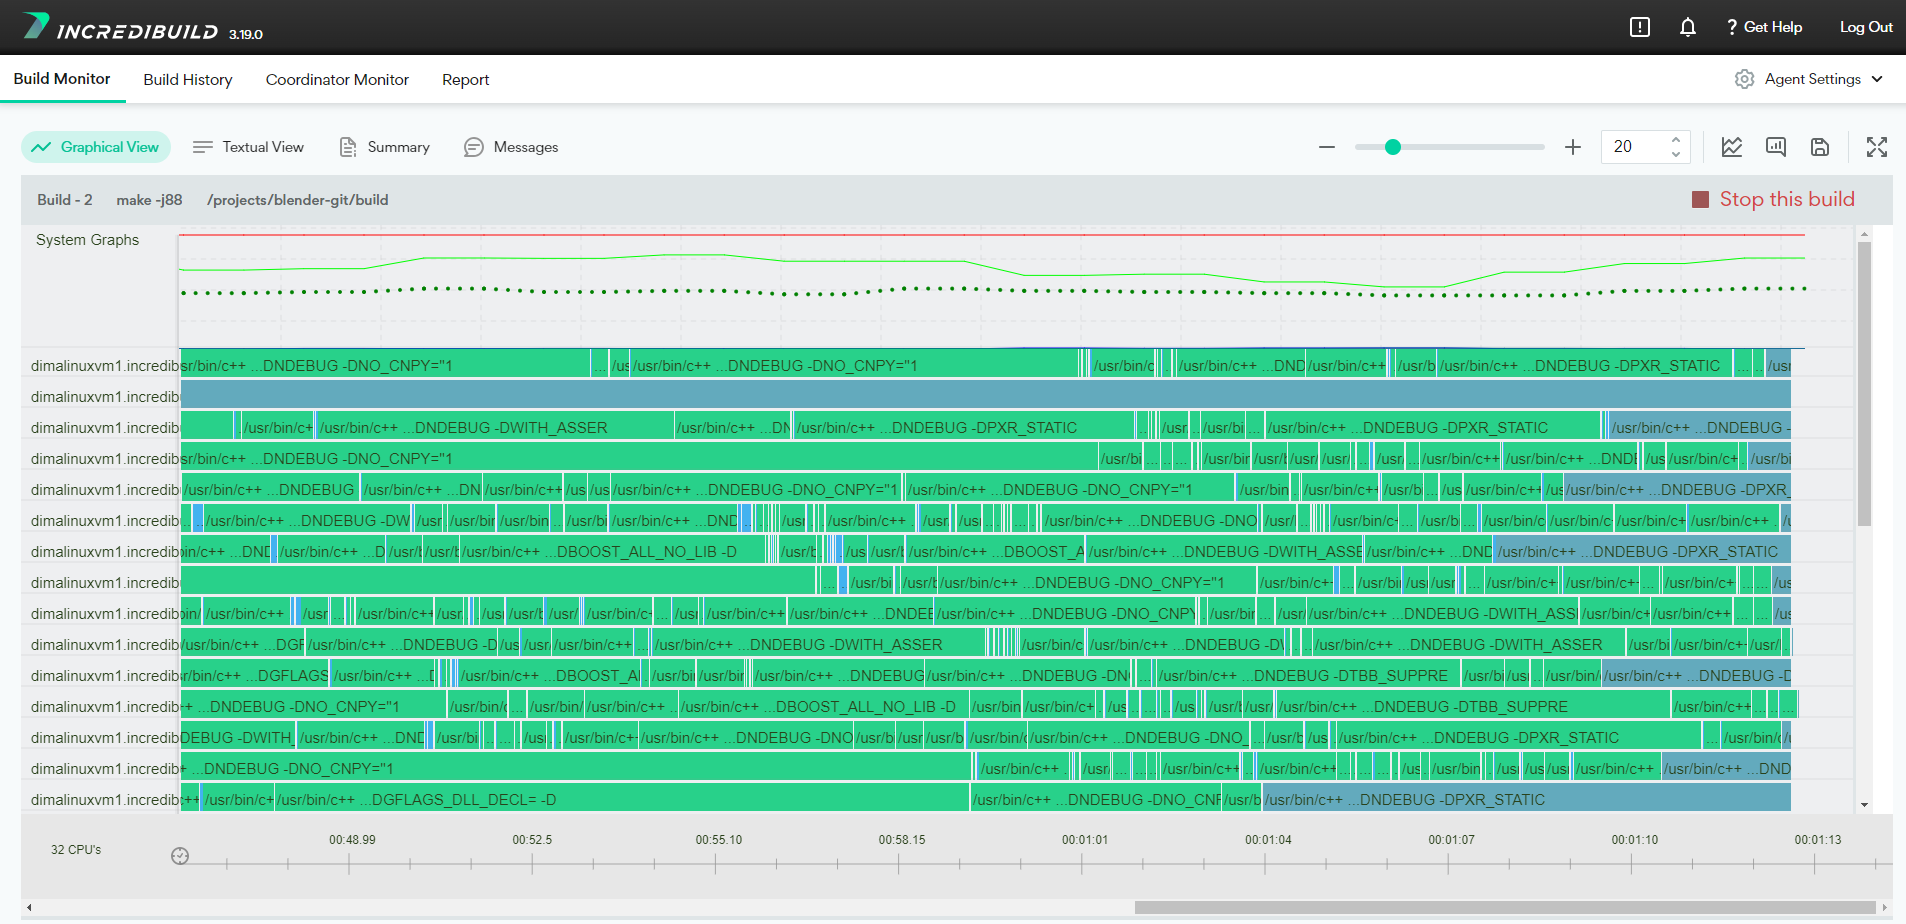
The Graphical View is divided into two sections:
- System Graphs - top pane
- Build Monitor Graph - bottom pane
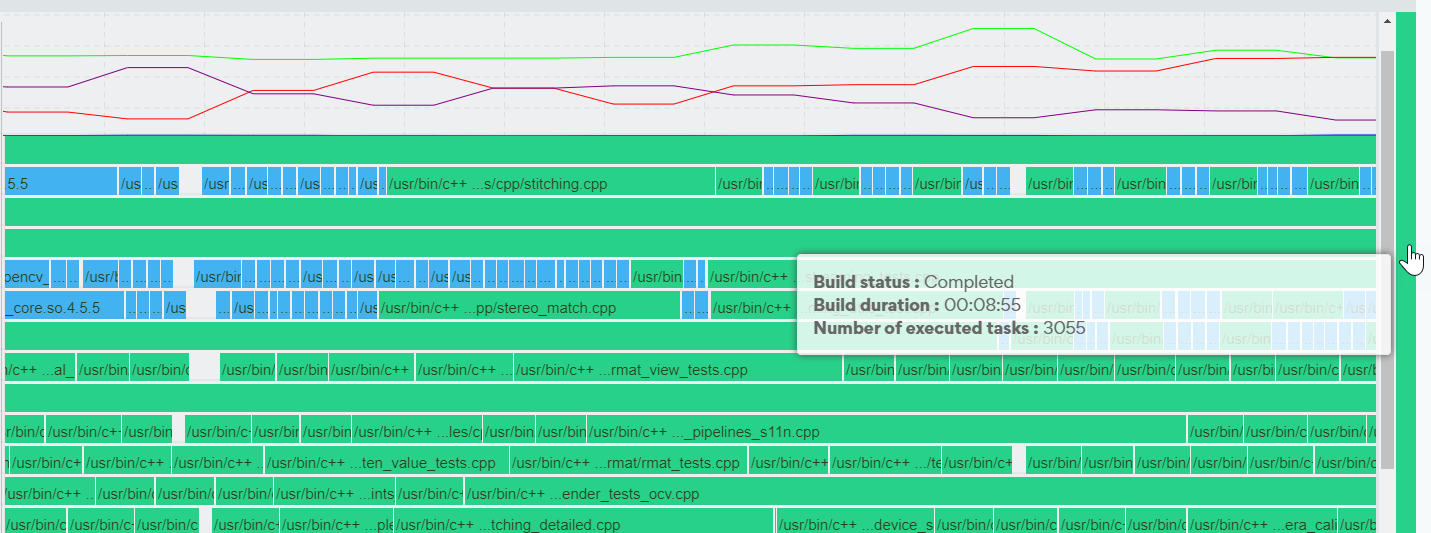
The Build Monitor - Graphical View also has a vertical Build Status Bar along the right edge of the screen.
System Graphs
The System Graphs show overall information such as used memory and CPU load over time. Hovering over the System Graph shows the system information at any point of time during the build:
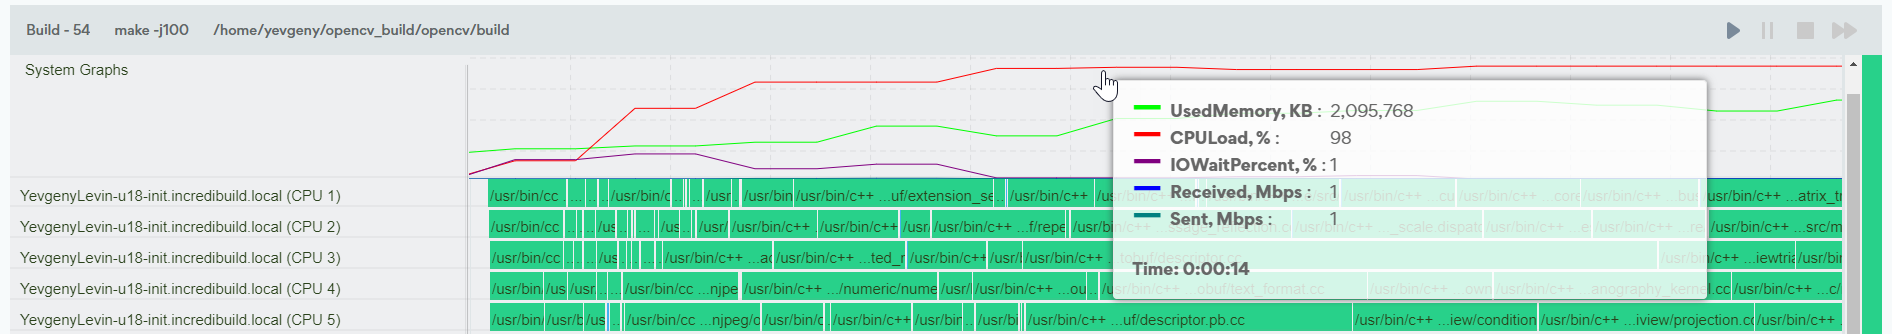
You can define which metrics are included in this graph in the Agent Settings > Graphs > Initiator Machine Statistics area.

The following metrics are available:
-
CPU Load: CPU usage on Initiator in percentage.
-
Used Memory: Memory usage on the machine.
-
SwapSize: Swap file utilization size.
-
IOWait: Time spent by all local CPU cores waiting on IO.
-
IOWaitPercent: Percentage of total CPU time spent waiting on IO devices.
-
ReceivedMpbs: Current incoming network load in Mpbs.
-
SenMpbs: Current outgoing network load in Mpbs.
-
AvailableSlots: Available cores that can be used in the build.
-
ActiveSlots: Active CPU cores executing tasks.
-
ActiveMachines: Number of machines participating in the build.
-
WaitingTasks: Number of tasks in queue waiting for execution.
-
LocalWaitingTasks: Number of tasks in queue that can only run on the Initiator.
-
DistributedWaitingTasks: Number of tasks in queue that can be run on any machine in the grid.
-
ActiveTasks: Number of currently executing tasks.
-
CompletedTasks: Tasks completed so far in the build.
Build Monitor Graph
The Build Monitor Graph illustrates how tasks are distributed between the Agent machines (CPUs) over time. The time axis displayed below the graph is the time that has elapsed from the beginning of the build. Clicking the clock icon on left side of the time axis will toggle between relative time and absolute time.
The Build Monitor Graph provides developers with the ability to have an intuitive graphical representation of their execution process, quickly locate errors and warnings, see the execution duration of each task, find performance bottleneck and retrieve detailed information on every task that is executed as part of the build process.
Hovering on a task block displays the process ID, name, task ID, and exit code of the process.
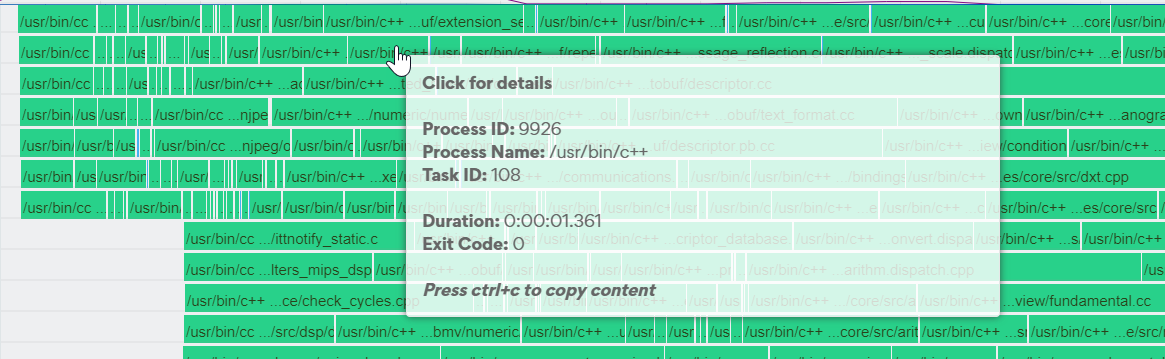
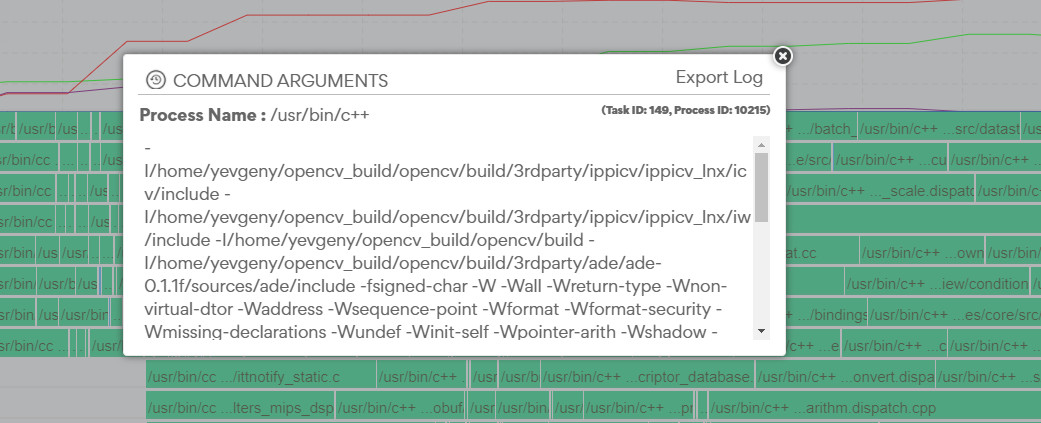
Clicking on a task block displays more detailed information such as the process name, command arguments, task ID, and any warnings or errors.
Block colors
Each colored block represents a single task in the build. The various colors represent the various task statuses.
-
 In-progress
 -
 Successful task that can only be executed locally on the initiating machine
 -
 Successful task that can be distributed to remote machines
 -
 Warning - task with stderr that exited with exit code 0
 -
 Failure - task which exited with non 0 exit code
 -
 Aborted task


Build Status Bar
The vertical status bar along the right edge of the screen is colored according to the status of the build. The colors indicate the following:
-
Green - Build completed successfully, without warnings.
-
Yellow - Build completed successfully, with warnings.
-
Red - Build failed or was aborted.
Hovering over the Build Status Bar displays a detailed description of the build status.