Dashboards
The Builds Dashboards provide valuable visual insights into your builds such as average duration, total builds, and more. You can access the Dashboard by going to the Coordinator Manager and clicking the Dashboard icon.
This can help you discover areas you might need to investigate such as:
-
Changes to trends in average build times
-
Failed or canceled builds
-
Peak times for load on your grid
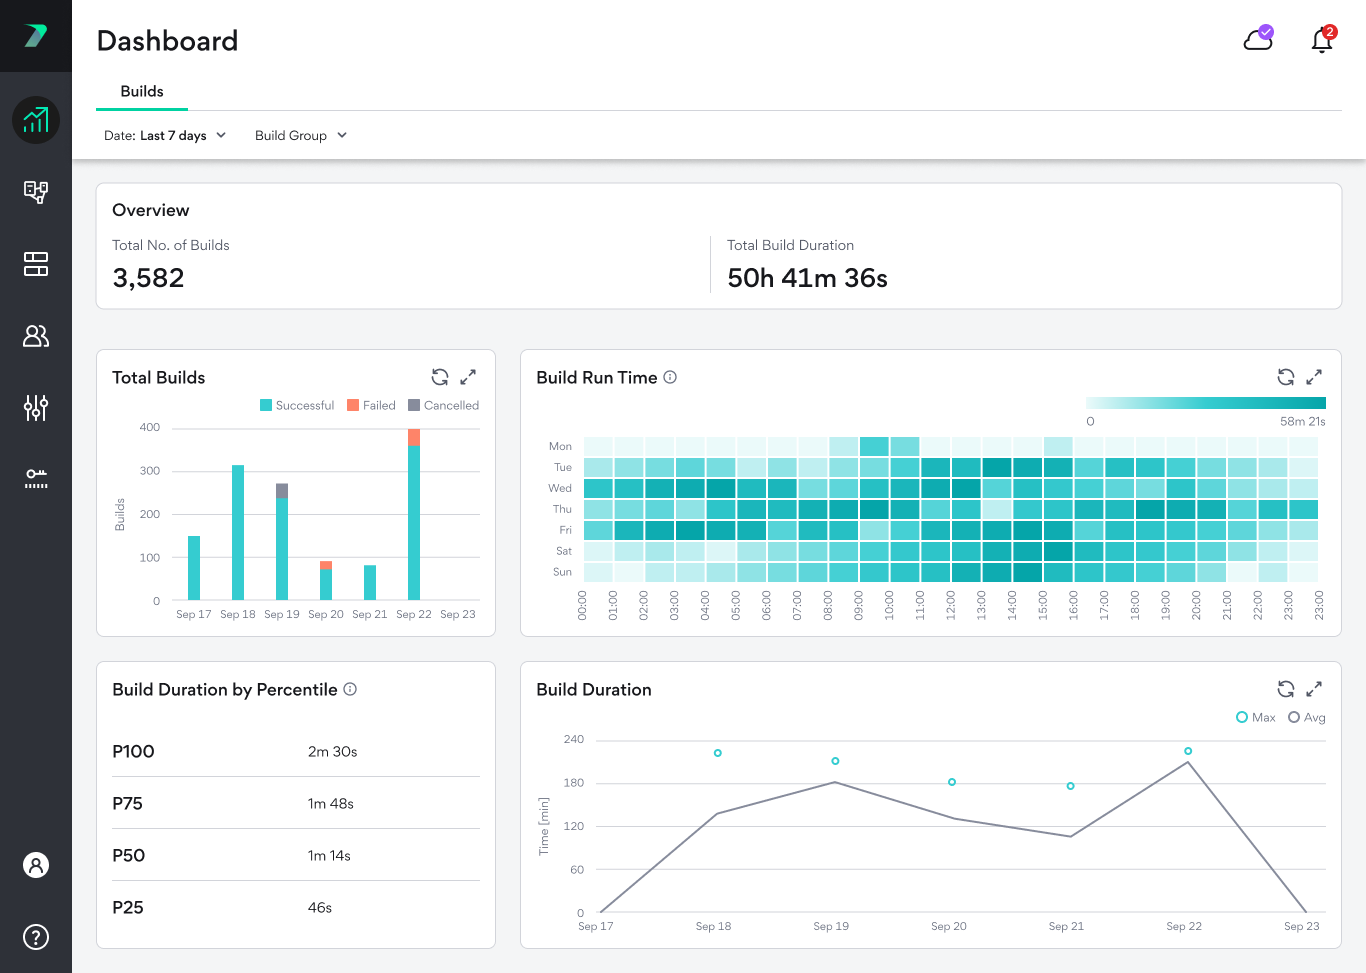
The data contains a summary at the top and a number of different graphs. Both the overview and the graphs share a single filter which you can use to control the time frame, or view data for a specific Initiator type, Build Group, or Build type.
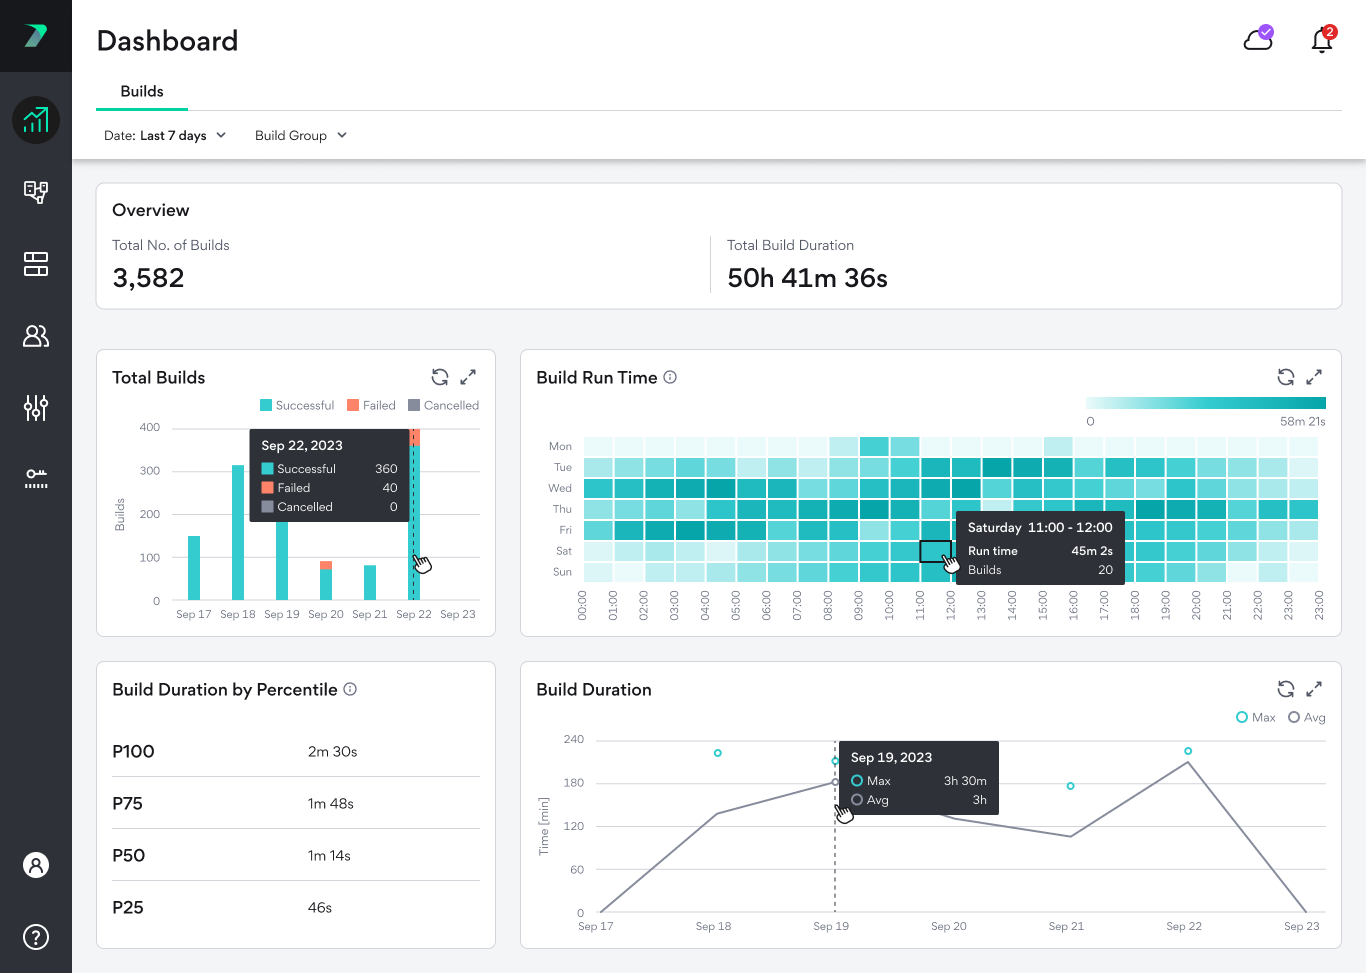
You can view more information by hovering over each graph:
Time Zones
When viewing the dashboards, the times displayed are from the perspective of the viewer's browser. This means that the times will look different depending on who is viewing the data.
Build Dashboards
Overview
The overview bar shows you the total number of builds that were run and their total duration over the selected time period.

Total Builds
This graph shows you the total number of builds in different time periods and shows how many of the builds were successful, failed, or were canceled.
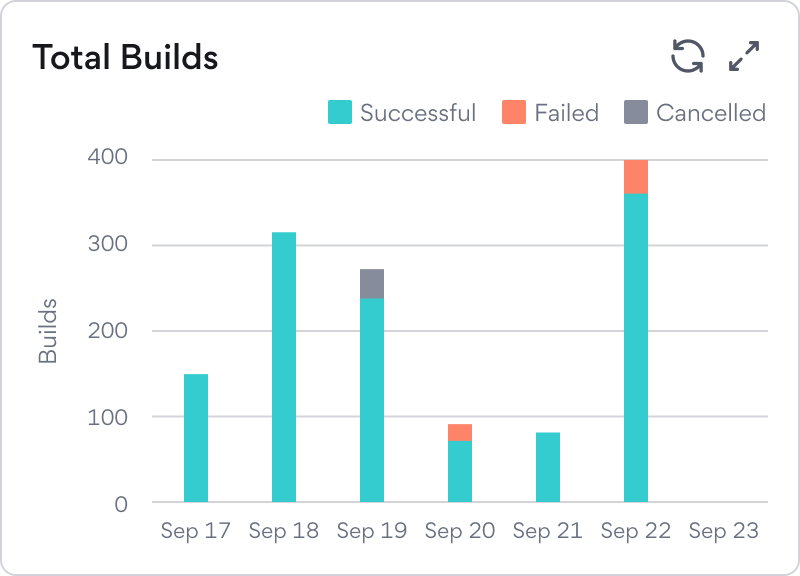
Clicking on the bars will take you to a filtered version of the Build List .
Build Run Time
A trend analysis graph that displays the total duration of all builds in each time period. The time periods are designed to highlight weekly patterns and allow you to track the load on your grid throughout different times of the day. If a time period of more than 7 days are selected, the average values are displayed. For example, if you selected a 30 day time period, one box might represent the same hour in four different weeks. In this case, we calculate the total run time for each of the values, and display the average of the four values.
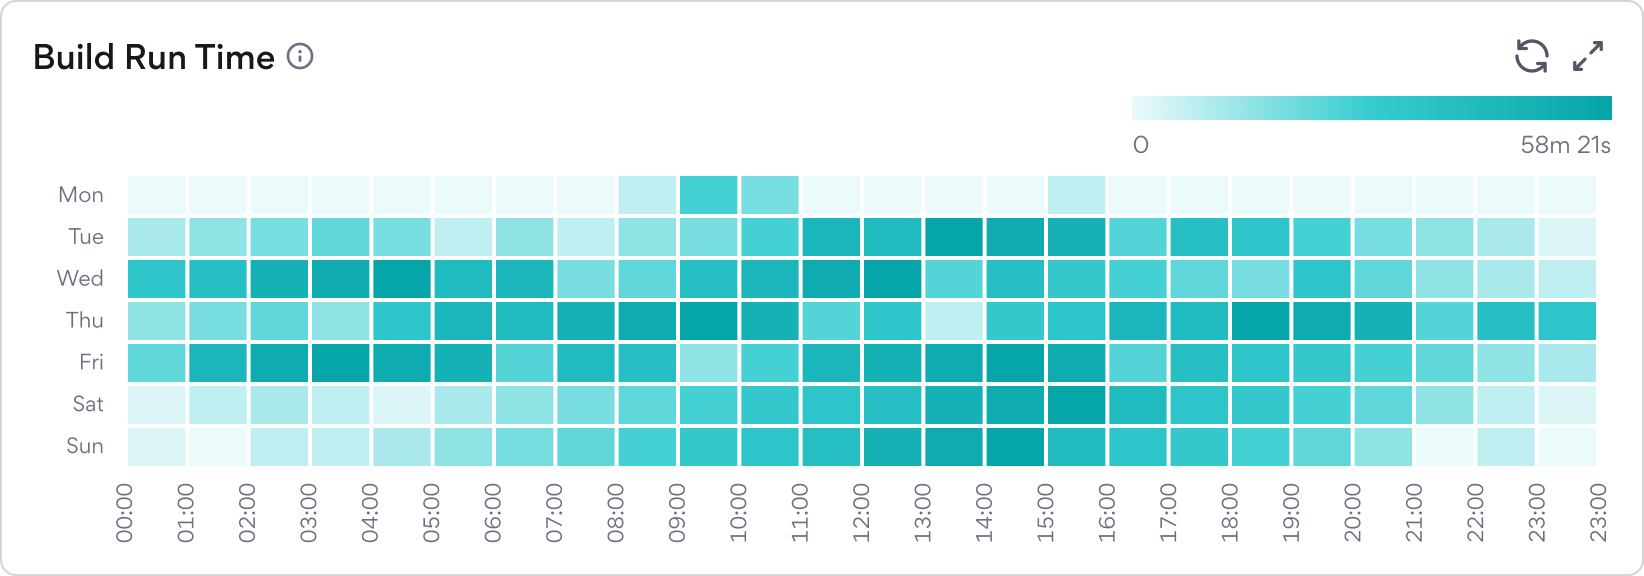
Clicking on the boxes will take you to a filtered version of the Build List .
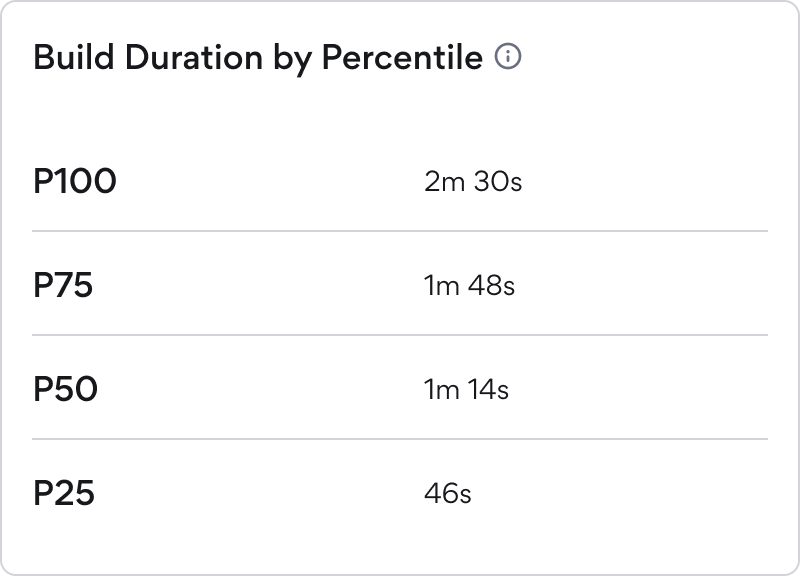
Build Duration Percentile
Displays the build duration broken down by percentile for the selected time period. For example, 75 percent of builds were shorter, and 25 percent of builds were longer that the value of P75 (1 minutes and 48 seconds in the image below).
This graph only populated when there are 100 or more builds during the selected time period to ensure that it provides accurate and meaningful data.
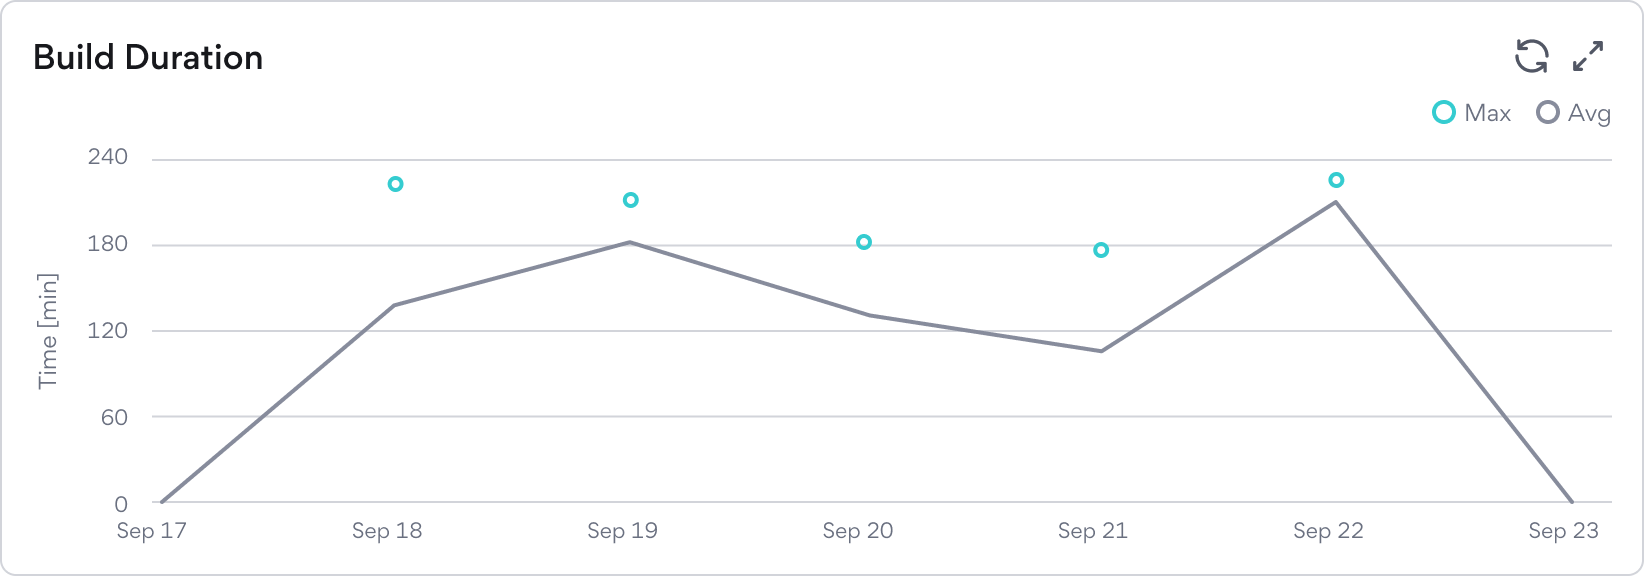
Build Duration
Displays the average and maximum durations builds per day.