The Build Monitor Settings
The Build Monitor allows you to visually watch your build's progress. This has major advantages over regular text-based output, such as the ability to analyze your build, which makes it much easier to detect errors, find bottlenecks, and fix issues currently holding back your build's progress.
Opening the Build Monitor
The Build Monitor is automatically opened when starting a build from the Visual Studio IDE or from the Agent Tray Icon.
It can also be opened by:
-
Selecting "Open Monitor" from the Incredibuild menu in the Visual Studio IDE.
-
Double-clicking the Incredibuild tray-icon.
-
Using the /OPENMONITOR command line console (BuildConsole and IBConsole).
Display Icons and Their Meanings
| Icon | Description |
|---|---|
| Progress display a visual representation of the distributed build process. | |
| Output display shows the entire build's output text, similar to what would have been generated by Microsoft Visual Studio C++ builds. | |
| Projects display relevant only for Microsoft Visual Studio C++ builds; shows for each project/configuration built, the standard output from the executed tools, including warning and error messages. | |
| Summary display contains information and statistics on the current build. | |
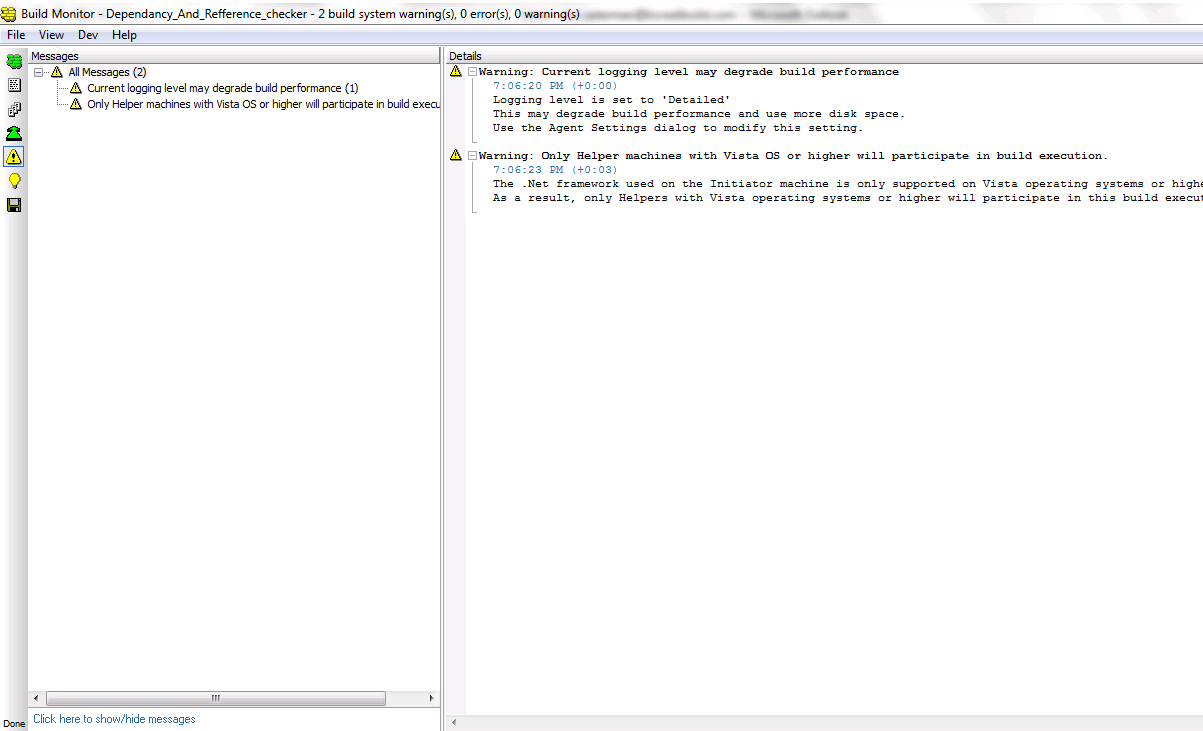
| Warning display displays warnings that are part of the execution; appears only if there are warnings. | |
| Did You Know? contains useful tips for making the most out of Incredibuild. |
The Build Display Options
The following sections describe the different build displays that can be selected by clicking the relevant icons in the vertical menu on the left-hand side of the Build Monitor:
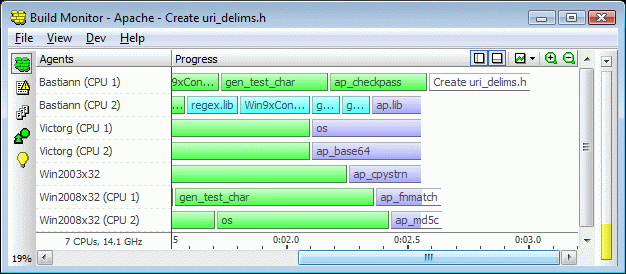
The Progress Display
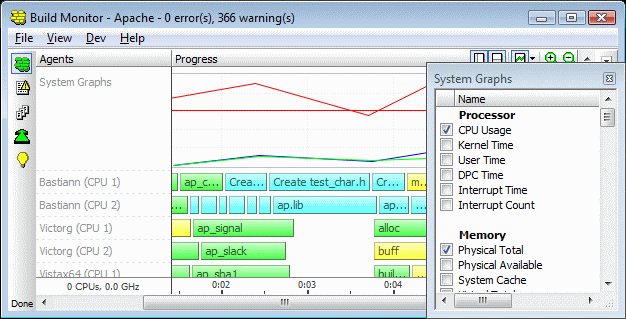
The Progress display, the Build Monitor's main view, shows a visual representation of the distributed build process. Each task is represented by a colored bar according to the type and status:
| Color | Task Type and Status |
|---|---|
| Purple | A currently running task. |
| Cyan | A locally running task (custom build steps, link operations, or creation of browse information) that terminated successfully. |
| Green | A distributable task that can run locally or on remote machines, (for example, compilation in Visual Studio, cl.exe), which terminated successfully. |
| Yellow | A task that generated build warnings. |
| Red | A task that failed to build. |
|
White |
A task was canceled or moved to a different helper. |
Hovering the mouse pointer over a colored bar displays the elapsed time until that point in the build, as well as any additional information available regarding that file. The display can also be panned to all directions (click and drag mouse) and zoomed in and out (CTRL/SHIFT+mouse click).
A context menu is displayed when right-clicking a progress bar. This menu offers the following options:
| Go to Output | Jumps to the corresponding line in the Projects display, which displays that file's output text. This action is also performed when double-clicking a progress bar. |
|---|---|
| Go to Source | Opens the source file in the MSVC editor. This option is enabled only when using the monitor from within the Microsoft Visual C++ development environment. |
| Zoom In / Zoom Out | Changes the horizontal scale of the display. Zooming in displays longer bars with more room for filenames. It is also possible to zoom in and out using the mouse scroll wheel or the +/- keys. |
| View Agents Bar | Shows or hides the left-hand side Agents list. |
| View Time Bar | Shows or hides the bottom bar displaying time units, progress, and processing power. |
| View System Graphs | Toggles the display of System Graphs, which can be used to monitor the system state. |
| Select System Graphs.. | While viewing system graphs, shows the graphs selection window. |
| Arrange Agents | Rearranges the order of Agents in the display so that Agents currently participating are displayed topmost. |
| Auto Arrange | When this option is selected, enables a mode of operation that ensures that Agents currently participating are always displayed topmost. |
The following two options, useful for troubleshooting, are available when right-clicking a bar, provided that the logging level is detailed:
- Save Detailed Log...–Saves a log file that can be sent to Incredibuild Support to analyze the executed process's execution.
- View Process Activity–Opens a viewer showing information for tracing execution of a remotely run process. The viewer shows stdout and stderr output for the executed process and its subprocesses, as well as PID information and environment blocks.
The buttons in the upper-right hand side of the display can be used to zoom in/out, show or hide the system graphs, and toggle the Agents bar/Time bar display.
Notes:
- In Visual Studio builds and Make and Build tools, double-clicking a bar automatically opens the output of the task that is currently running.
- If double-clicking a bar does not work well in a build run using either the Submission Interface or Automatic Interception Interface, this can usually be resolved using the IdentifyTaskOutput keyword.
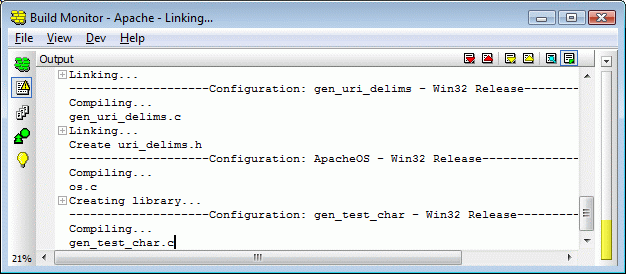
The Output Display
Similar in format to the Projects display, the Output display shows the build output for the entire execution, i.e. it shows everything run by Incredibuild. Its output is similar to that of Microsoft Visual C++, making it convenient to users accustomed to that output display.
When using the Output display, the following features are available (also available from the display's right-click context menu and the toolbar):
| Text Find Tool | Use the CTRL-F keyboard shortcut to perform text searches, and F3/SHIFT-F3 to find the next/previous occurrence of the text. |
|---|---|
| Next/Previous Error Message | Use the F8/CTRL-F8 keyboard shortcuts to navigate between error messages in the build output. When used from within the MSVC IDE, this also opens the source file at the relevant line of code in the editor. |
| Next/Previous Warning/Error Message | Use the F4/SHIFT-F4 keyboard shortcuts to navigate between warning and error messages in the build output. When used from within the MSVC IDE, this also opens the source file at the relevant line of code in the editor. |
| Bookmark options | Use the CTRL-K + K keyboard combination to toggle a bookmark on the current line. Use the CTRL-K + N (next bookmark) and the CTRL-K + P (prev. bookmark) keyboard combinations to jump between the defined bookmarks. |
| Open Source File | When used from within the MSVC IDE, double-clicking a message opens the source file at the relevant line of code in the editor. |
| Auto Scroll | When selected, the display scrolls automatically, always showing output for the last files built. Moving the cursor to any location in the text stops the display from scrolling. |
The Projects display supports this same list of features.
Note:
- In Visual Studio, as Incredibuild often builds more than one project at a time, some buffering of the build output is performed to ensure that the output of different configurations do not mix. This behavior may result in files not being shown in the Output display despite having already been built. To view build output for all files, use the Projects Display.
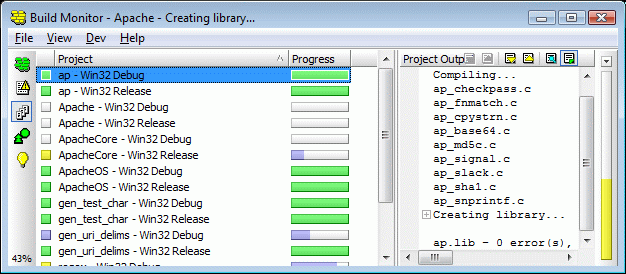
The Projects Display
The Projects Display is only relevant for Visual Studio builds.
The left pane of the Projects display shows a list of configurations participating in the current build.
Clicking a configuration name in the left pane displays that configuration's build output in the right pane of the display, in a format similar to MSVC's output window.
The Projects display supports the same list of features available in the Output Display.
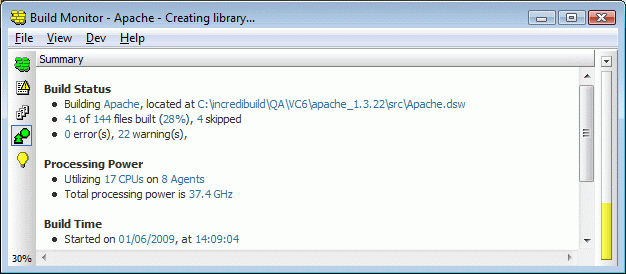
The Summary Display
The Summary Display shows various statistics describing the build process and status, as well as currently utilized processing power and license information.
The Warning Display
The Warning Display shows system warnings that occur during execution of builds by Incredibuild. You may want to hide warnings that you do not want to see, or display warnings that are currently hidden. This can be done in the Agent Settings->Build Monitor->Warnings dialog box, by clearing/selecting the check boxes of the warnings to hide/show.
System Graphs
The Progress view can be used to monitor various system parameters during a build.
To view system graphs:
- Right-click the display and select View system graphs.The graphs display opens, showing currently selected graphs.Hovering the mouse cursor over a graph displays values for currently displayed graphs at the selected point in time.
To control which system parameters are displayed:
-
Right-click the display and select Select system graphs....A window allowing control of the system parameters and their corresponding graph color is displayed.
Cool Monitor Features
From the Build Monitor, you can do the following:
-
View the output distribution of any project, by double-clicking a bar in the Projects display.
-
Jump to the first warning or error in the build output, by double-clicking a yellow or red status bar.
-
Choose the way the status bar calculation handles files that were skipped during the build (count them as completed or disregard them altogether), by clicking the small down-arrow icon located just above the status bar.


