Build List
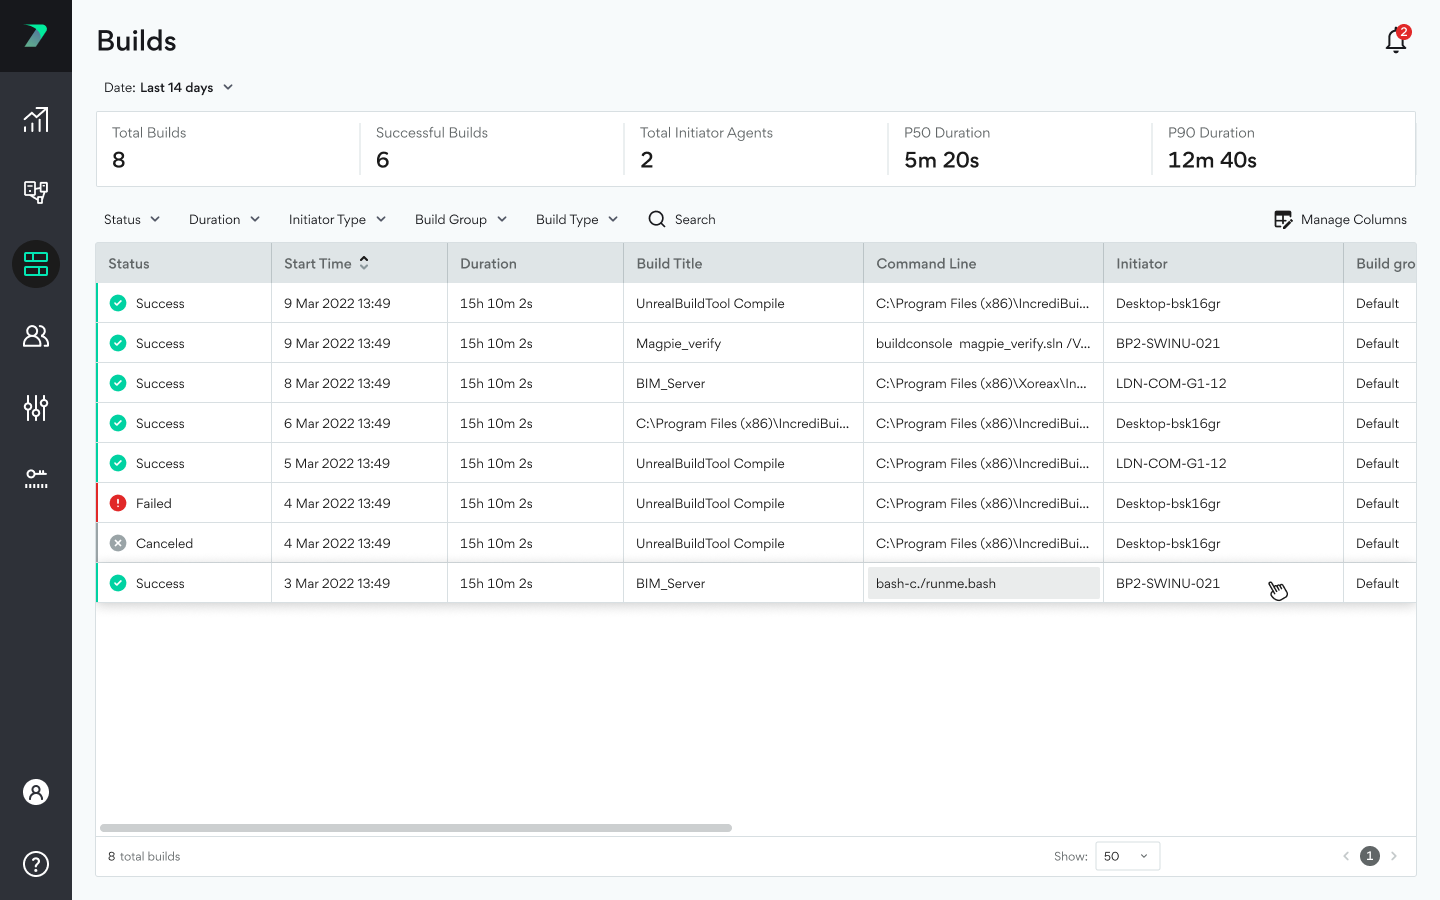
The Build List allows you to view recent builds and their details. You can filter the list by date at the top of the page. Data is available for the last 14 days, but you can also limit the data to shorter time periods.
For enterprise customers, the build list stores the latest 200,000 builds are available regardless of how long ago they were run.
Time Zones
The times displayed are from the perspective of the viewer's browser. This means that the times will look different depending on who is viewing the data.
Overview Bar
The overview contains a summary of your builds during the selected time period and includes:
-
Total Builds: The total number of builds that were run.
-
Successful Builds: The total number of builds that were successfully run.
-
Total Initiator Agents: The number of unique Initiator Agents that initiated at least one of the build.
-
p50 Duration: The mean duration of your builds. 50 percent of builds were longer, and 50 percent of builds were shorter than this value.
-
p90 Duration: The duration of the build that is the 90th percentile in terms of duration. 90 percent of builds were shorter, and 10 percent of builds were longer that this value.
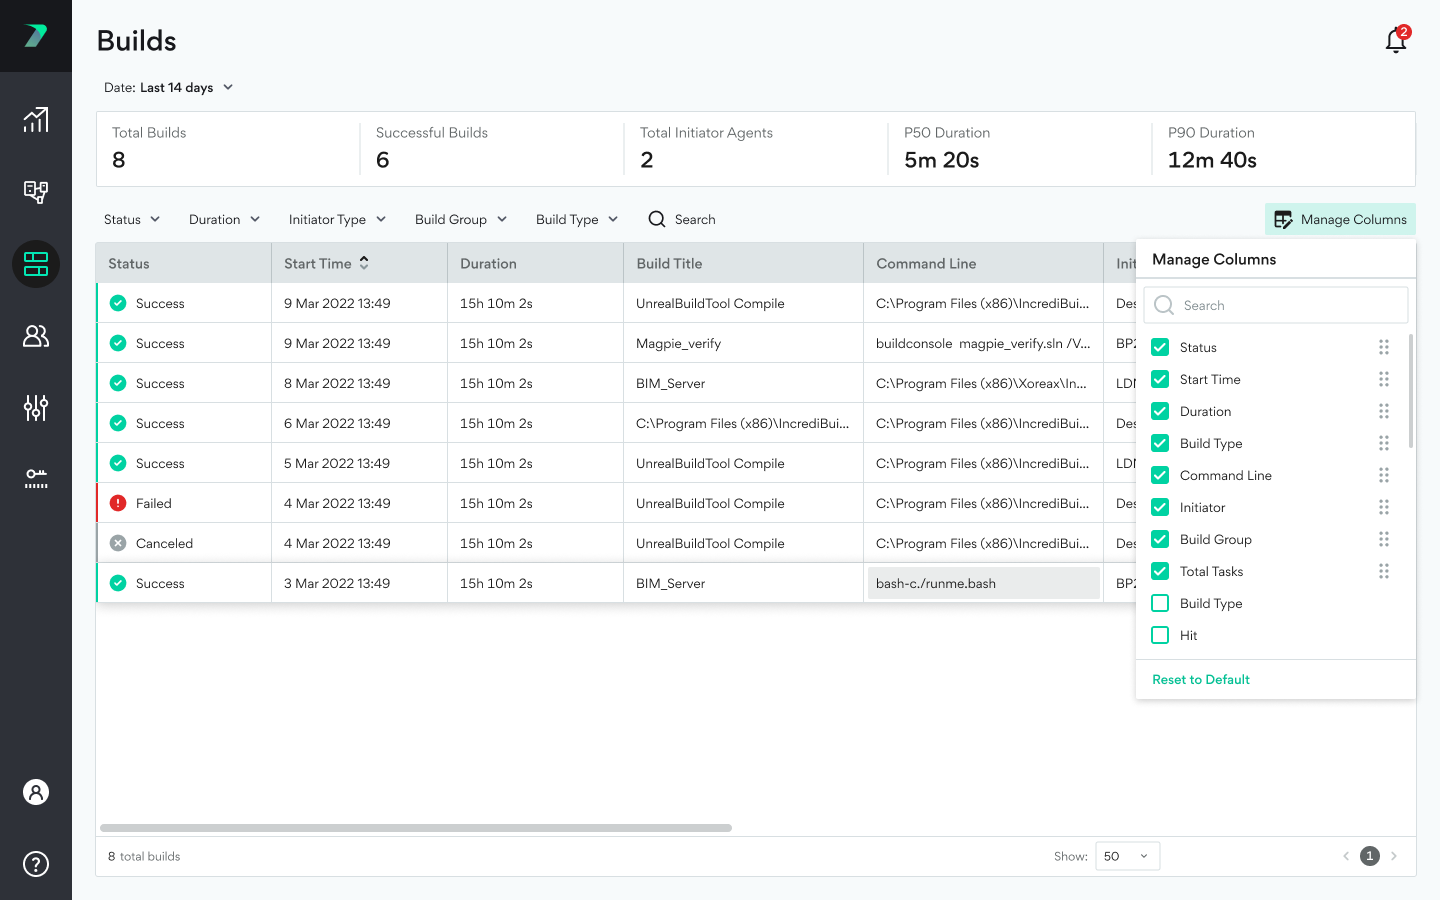
Manage Columns
You can modify the columns using the Manage Columns button. Changes take effect immediately after checking or unchecking the boxes.
Build List
You can filter the build list by status, type, duration, or Build Group. You can also filter by searching the list for strings in the Build Title, Initiator, and Command Line values of your builds. The list contains the following columns:
-
Status: Whether the build was completed with a status of Success, Failed, or Canceled.
-
Build Title: If you included a title in your build command to help identify the build, you can view it here.
-
Command Line: The command that was used to run the build.
-
Initiator: The name of the initiator that initiated the build.
-
Build Group: The Build Group that the initiator belongs to.
-
Start Time: The start time of the build.
-
Duration: The duration of the build.
-
Failure Reason: If relevant, the reason the build failed.
-
Total Tasks: The total number of tasks in the build.
-
Remote Tasks: The number of tasks that were executed by an on-prem remote helper agent.
-
Cloud Tasks: The number of tasks that were executed by a cloud helper agent.
-
Local Tasks: The number of tasks that were executed on the local machine.
-
Max. Helper Cores: The maximum number of helper cores used at one time.
-
Average Helper Cores: The average number of helper cores used at one time.
-
Hit: When using Build Cache, this is the number of tasks that were Build Cache hits, reusing content from the cache.
-
Max Needed Helper Cores: The maximum demand for helper cores at one time.
-
Miss: When using Build Cache, this is the number of tasks that were Build Cache misses.
-
Uncachable Tasks: When using Build Cache, the number of tasks that are not cachable and are executed or distributed normally.
-
Agent Description: A description of the Initiator Agent.
-
Log Level: The log level for the build (1 is the lowest level).
-
Logged on Users: A list of windows users who were logged on to the Initiator machine when the build started.
-
Unmet Helper Requests: The percentage of time during the build in which helper demand was greater than the supply.
-
Failed Tasks: The number of tasks that failed during the build.
-
Distributable Tasks: The number of tasks that had the potential to be distributed to a remote Helper Core. Only includes tasks that were executed (not taken from the cache)
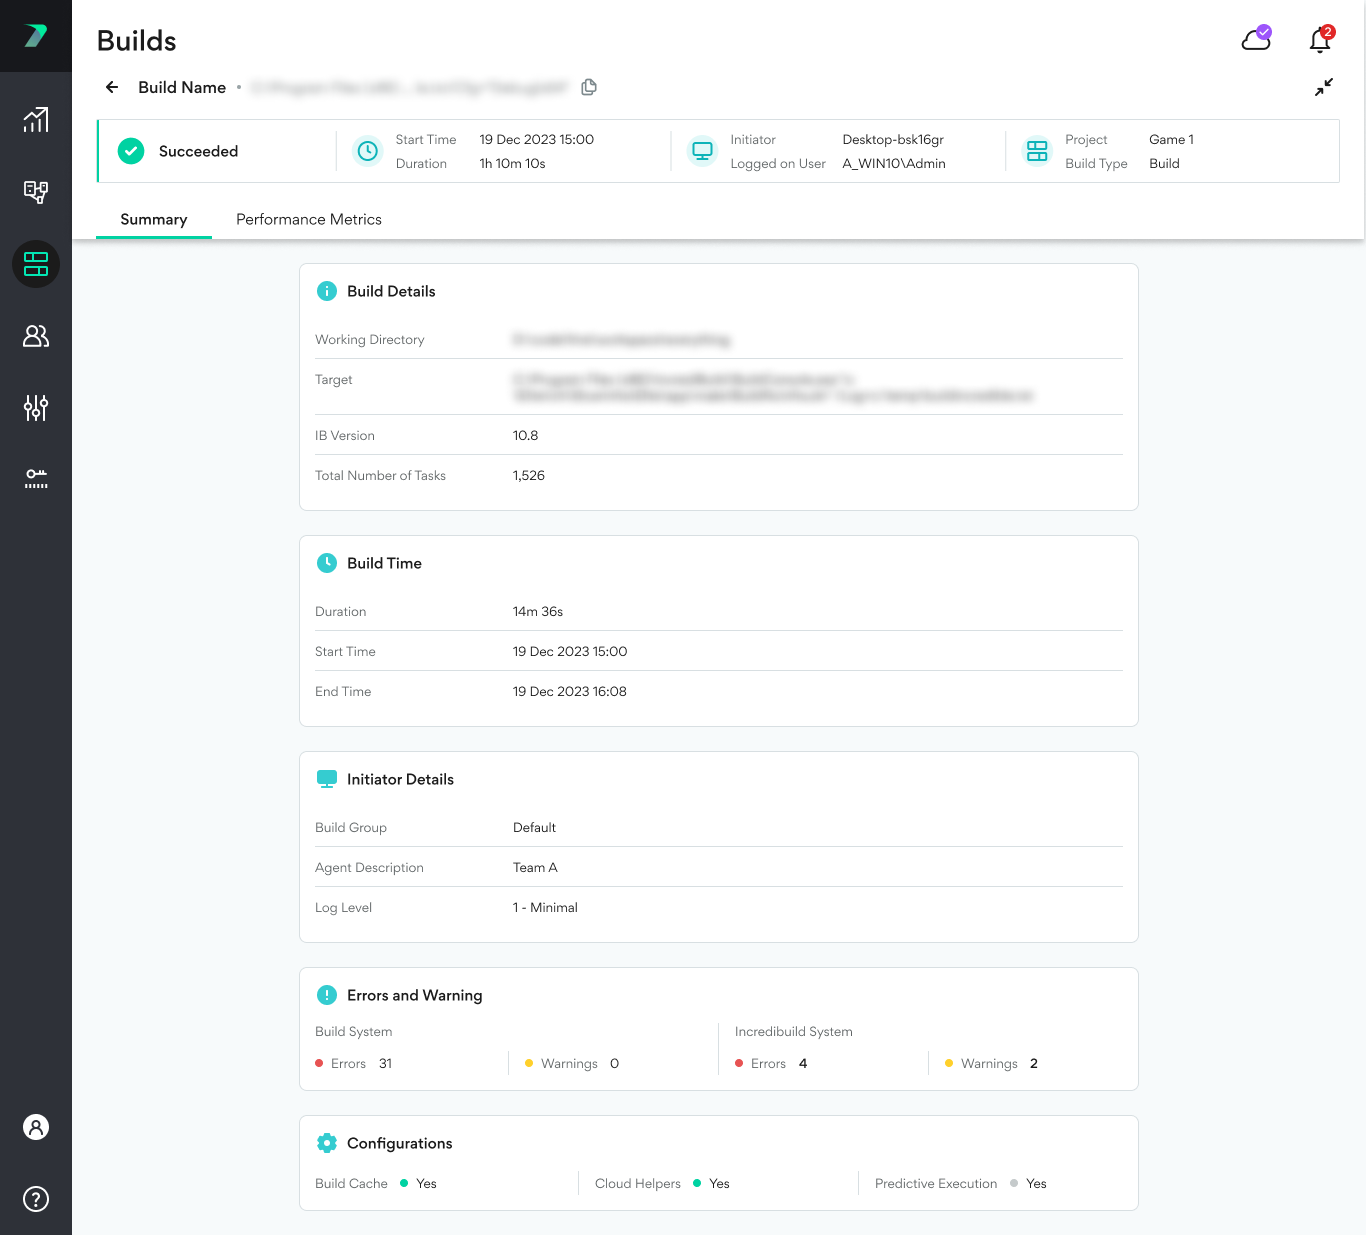
Builds Page (beta feature)
Clicking on any build in the Build List will open the Builds page. This page contains a large amount of information about an individual build.
The Summary tab contains general information such as:
-
Whether the build succeeded or failed and how long it took
-
The version of Incredibuild that was used
-
Which Initiator machine and build command was used to generate the build
The Performance Metrics tab contains many more details to allow you to really learn about individual tasks that may have affected your build.
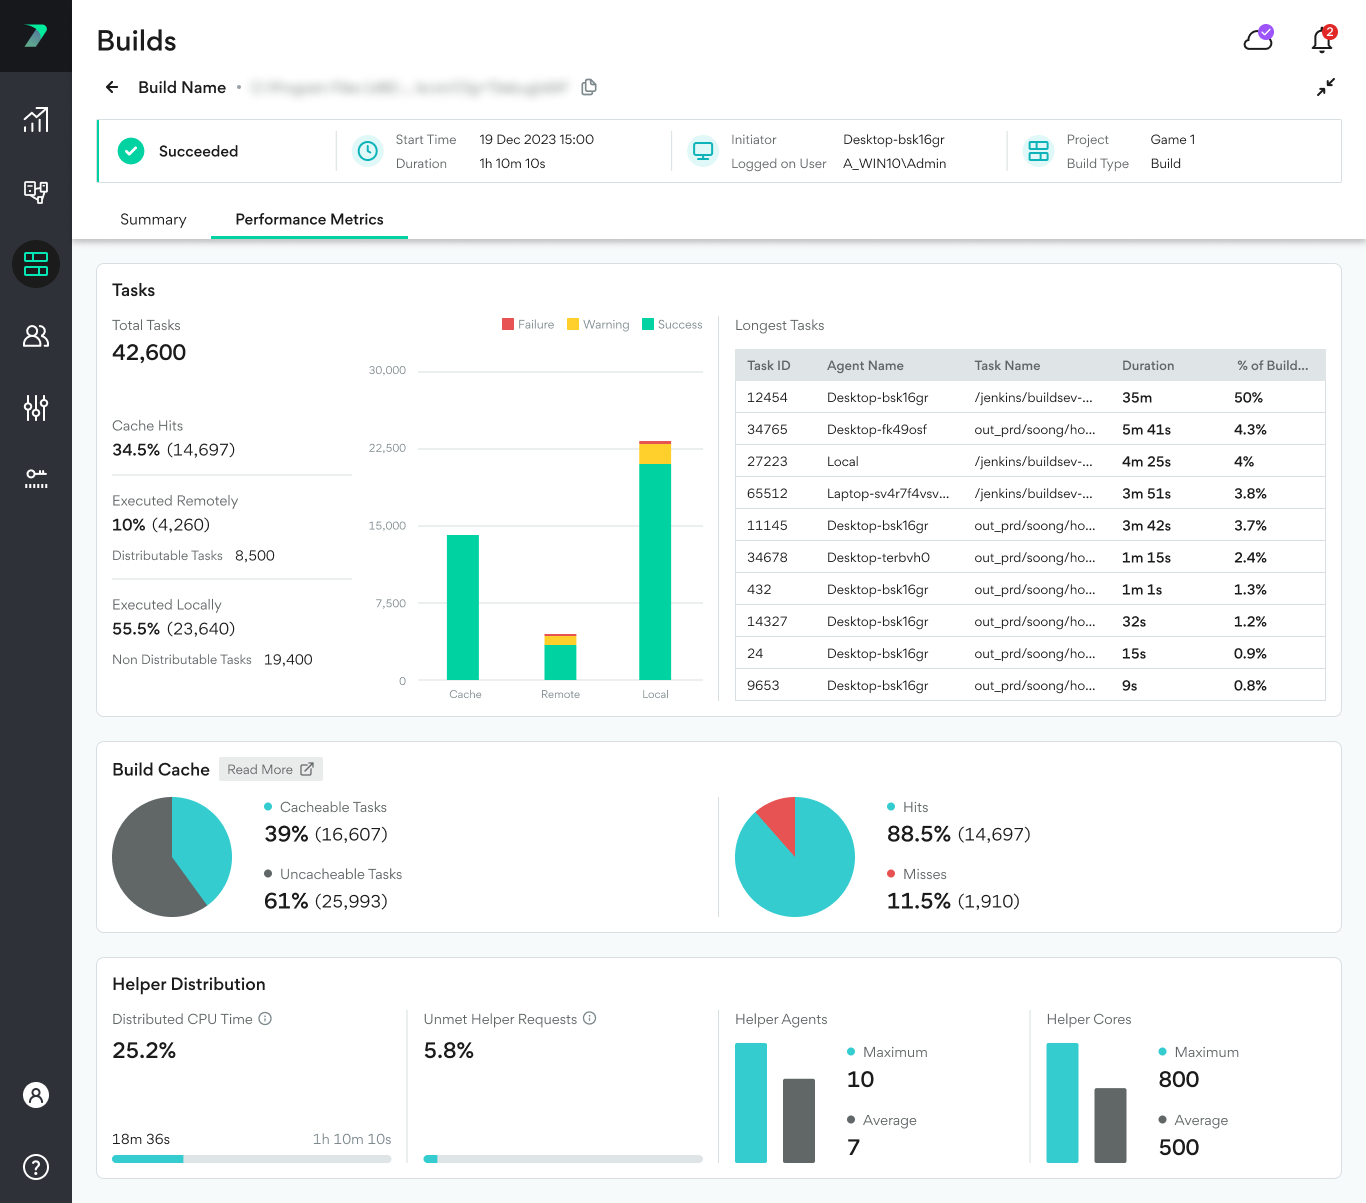
The following are explanations about the elements in the Performance Metrics user interface:
Tasks:
-
Total Tasks: The total number of tasks in the build. This includes tasks that were executed, and also tasks that were taken from the Build Cache and did not need to be executed.
-
Cache Hits: Tasks that were not executed because they were fetched from the Build Cache.
-
Executed Remotely: Tasks that were executed on a remote Helper Agent (on prem or Cloud).
-
Distributable Tasks: Tasks that had the potential to be executed on a remote Helper Agent. This number does not include tasks that were fetched from the Build Cache (cache hits).
-
-
Executed Locally: Tasks that were executed on the Initiator Agent.
-
Non-Distributable Tasks: Tasks that could only be executed on the Initiator Agent. This number does not include tasks that were fetched from the Build Cache (cache hits).
-
-
Longest Tasks: Displays information about the individual tasks that took the longest to execute.
Build Cache
-
Cacheable Tasks: Tasks that had the potential to be cached.
-
Uncacheable Tasks: Tasks that did not have the potential to be cached.
-
Hits: Tasks that were not executed because they were fetched from the Build Cache.
-
Misses: Tasks that were executed because there was no match in the Build Cache.
Helper Distribution:
-
Distributed CPU Time: The total CPU time for tasks that were distributed (on prem or cloud), divided by the total CPU time for all tasks.
-
Unmet Helper Demand: The percentage of time that there was unmet demand for Helper Agents.
-
Helper Agents: The average and maximum number of Helper Agents during the build. The average is actually the non-zero average and only includes data for times when there was some demand.
-
Helper Cores: The average and maximum number of Helper Cores used during the build. The average is actually the non-zero average and only includes data for times when there was some demand.