Build Cache - Monitoring and Diagnosing Efficiency
This feature is only available in Incredibuild's Enterprise and Business Plans and is currently in limited availability. For more details, speak to your Customer Success Representative.
Monitoring the Effectiveness of Build Cache
Details of how much time was saved from using the Build Cache is included in the output of all of your builds. This can be seen in the output tab of the Build Monitor, as well as the output you see in the command line.
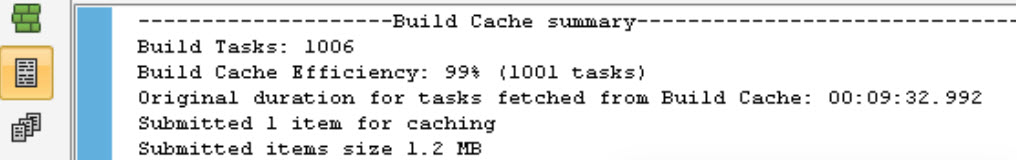
You can also see the cache hit rate in the Build Monitor graphs.

-
Tasks to cache are tasks that were executed and are candidates to be added to the Build Cache for future builds.
-
Cache hits are tasks that were retrieved from the Build Cache instead of being executed.
Examining Cache Efficiency Further
If the hit rate is low, you can investigate the reason by enhancing the output to include information about each task. Go to Agent Settings > Initiator > Build Cache Client Settings and check the Include more details in build output box.
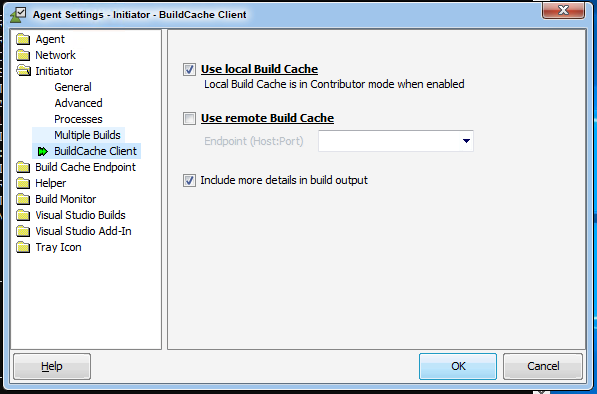
Run another build, and the build output will now include extensive information about each task, including whether is was a hit or miss, and in case of cache miss it will show you the reason for the miss.
This will allow you, for example, to identify frequently changing header files or auto-generated code which is not cache-friendly (not deterministic).
For example, the following output excerpt shows that this task was re-executed because BASE.H was changed (compared to previous builds stored in the cache):

In another example, this task was re-executed because the file VERSION.CPP was changed, as evident from the different content fingerprint:
