Dashboard Overview Page
The Overview page displays general information about your usage of Incredibuild. It shows information about how effectively you are using Incredibuild across your entire deployment. It also shows important information about your license status and how the license core packages and solutions are distributed across your Incredibuild infrastructure.
7 Day Overview
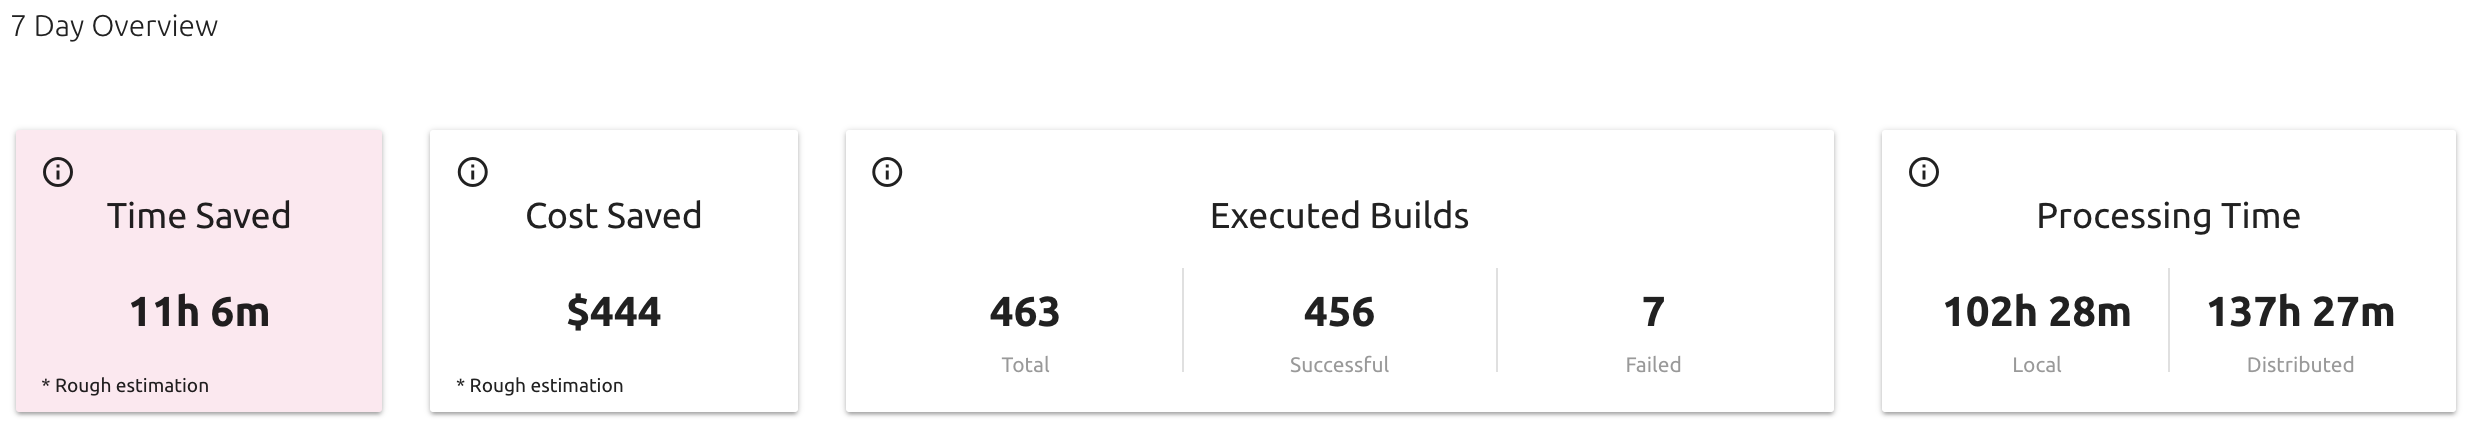
This area shows the overall values for the key performance indicators (KPIs) for your Incredibuild infrastructure over the past week as well as a graphic representation of the breakdown of the KPI values over time. This gives a general indication of how effectively you are using the Incredibuild infrastructure in terms of savings for time, cost, and effective build distribution.
Overview KPI Summary
The 7 Day Overview shows aggregated statistics for the KPI measures over the past week. It shows the total savings in terms of time and cost as well as an indication of how successful the build executions were and how effectively they were distributed to remote Agents. All values shown in the KPI Summary are based on data from the previous 7 days.
In order to provide a simple and complete overview, the Overview page does not allow you to adjust the time range or set filters. On the Agents and Builds pages you can set time ranges and add filters according to your needs.
The information displayed in the KPI Display is described in the following table:
|
Category |
Item |
Description |
|---|---|---|
|
Time Saved |
- |
This is a rough estimate of how much longer it would have taken to run all of the build executions if they had been executed without using Incredibuild (i.e. the builds were run entirely on the Initiator Agents) This calculation is made by taking the aggregate of the core-hours (a core-hour is an hour of utilization of each core, e.g. a 4 core machine running for one hour and fully utilizing all of its cores iswouldFully utilizing all its cores would… be considered to have utilized four core-hours) of utilization of all remote (i.e. Helper) Agents and dividing that by the number of cores on the Initiator Agents. Since usage of the remote Agents is less efficient than usage of the Initiator Agents (because of I/O and Network factors etc.), the result is divided in halfby 1.5. For example, if the Initiator Agent has 4 cores and the build ran for an hour using an additional 12 cores on remote Agents. Then we take the 12 core-hours and divide that by the 4 cores on the Initiator Agent which yields the result of 3 hours. We then take that number and divide it by 1.5 to reach the result that the Time Saved for that build was 2 hours. Since this calculation is based on a series of assumptions and approximations, the result should be viewed as a rough estimate of the actual time saved. |
|
Cost Saved |
- |
This measure indicates the cost savings you gained by using Incredibuild. Incredibuild cuts the downtime that the developer spends waiting for a build to be executed. This translates into cost savings for your company. The default value attributed to this savings is set as $40 per hour, but you can adjust this on the Configuration page. Therefore, this measure is calculated by multiplying the Time Saved by 40. |
|
Executed Builds |
Total |
The total number of builds executed using Incredibuild. |
|
Successful |
The number of builds successfully completed using Incredibuild. |
|
|
Failed |
The number of builds that were initiated using Incredibuild that were not completed successfully. This number includes builds that failed to execute, as well as builds that were aborted by the system or by the user. |
|
|
Processing Time |
Local |
The total number of core-hours of execution of Incredibuild tasks on local (i.e. Initiator) Agents. A core-hour is an hour of activity of an individual core. For example, if an Agent with 8 cores ran for one hour utilizing all of its cores, the processing time is 8 core-hours. |
|
|
Remote |
The total number of core-hours of execution of Incredibuild tasks that were distributed to remote (i.e. Helper) Agents. |
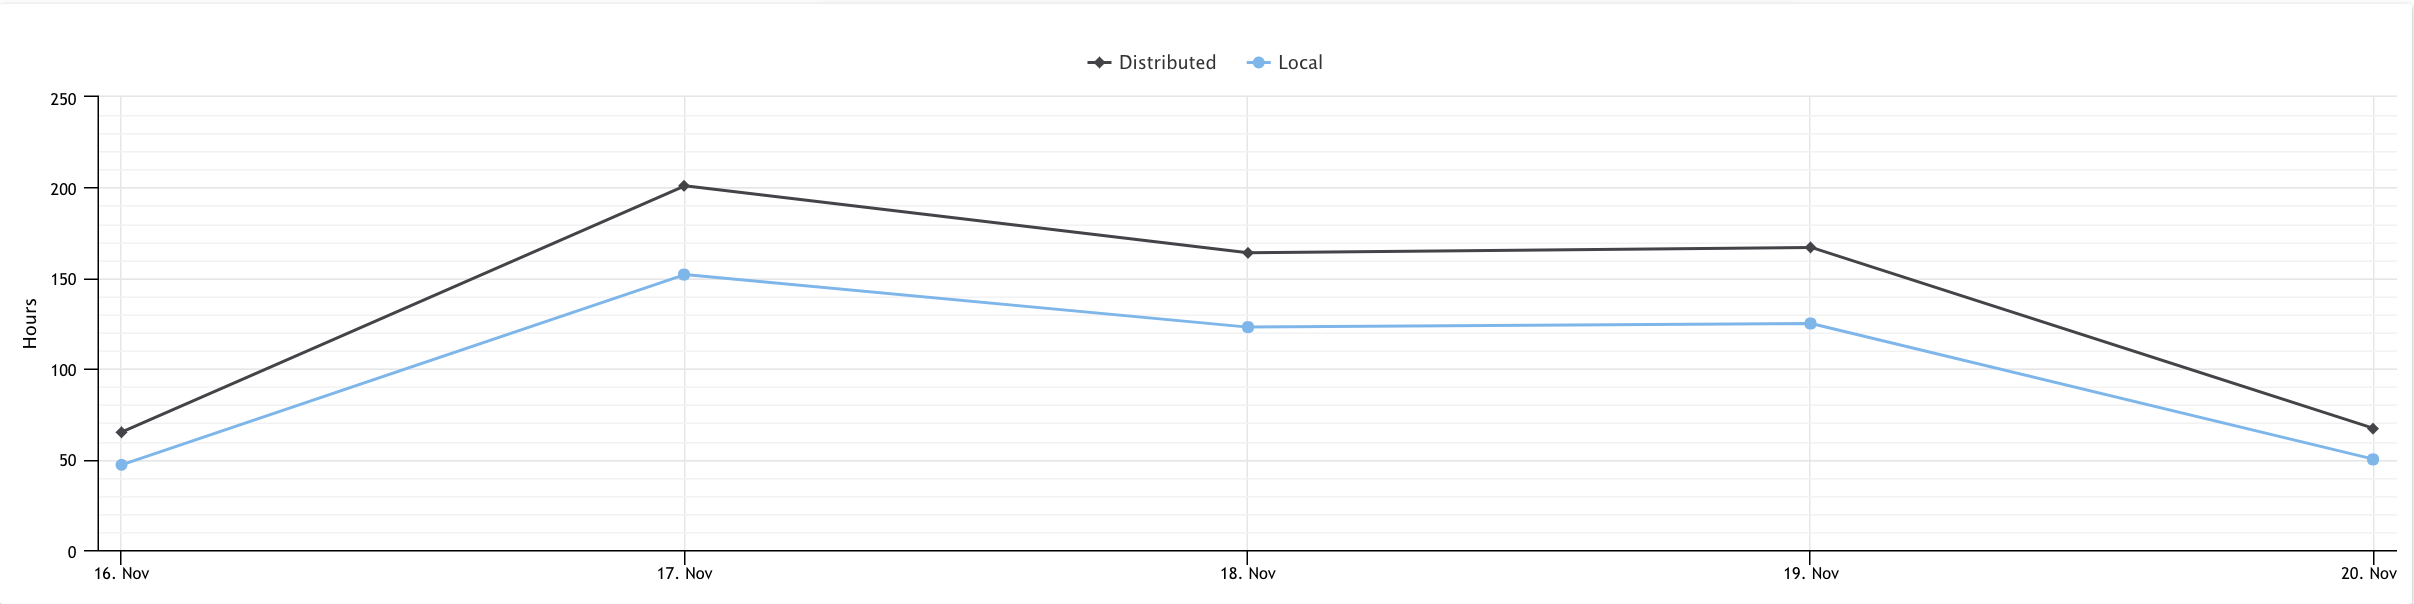
Overview KPI Graphic Display
Clicking any of the 7 Day Overview KPI values changes the display to a relevant in-depth visual representation of the values on any given day of the week, so you know exactly where the values come from and on which days.
Understanding the Display
-
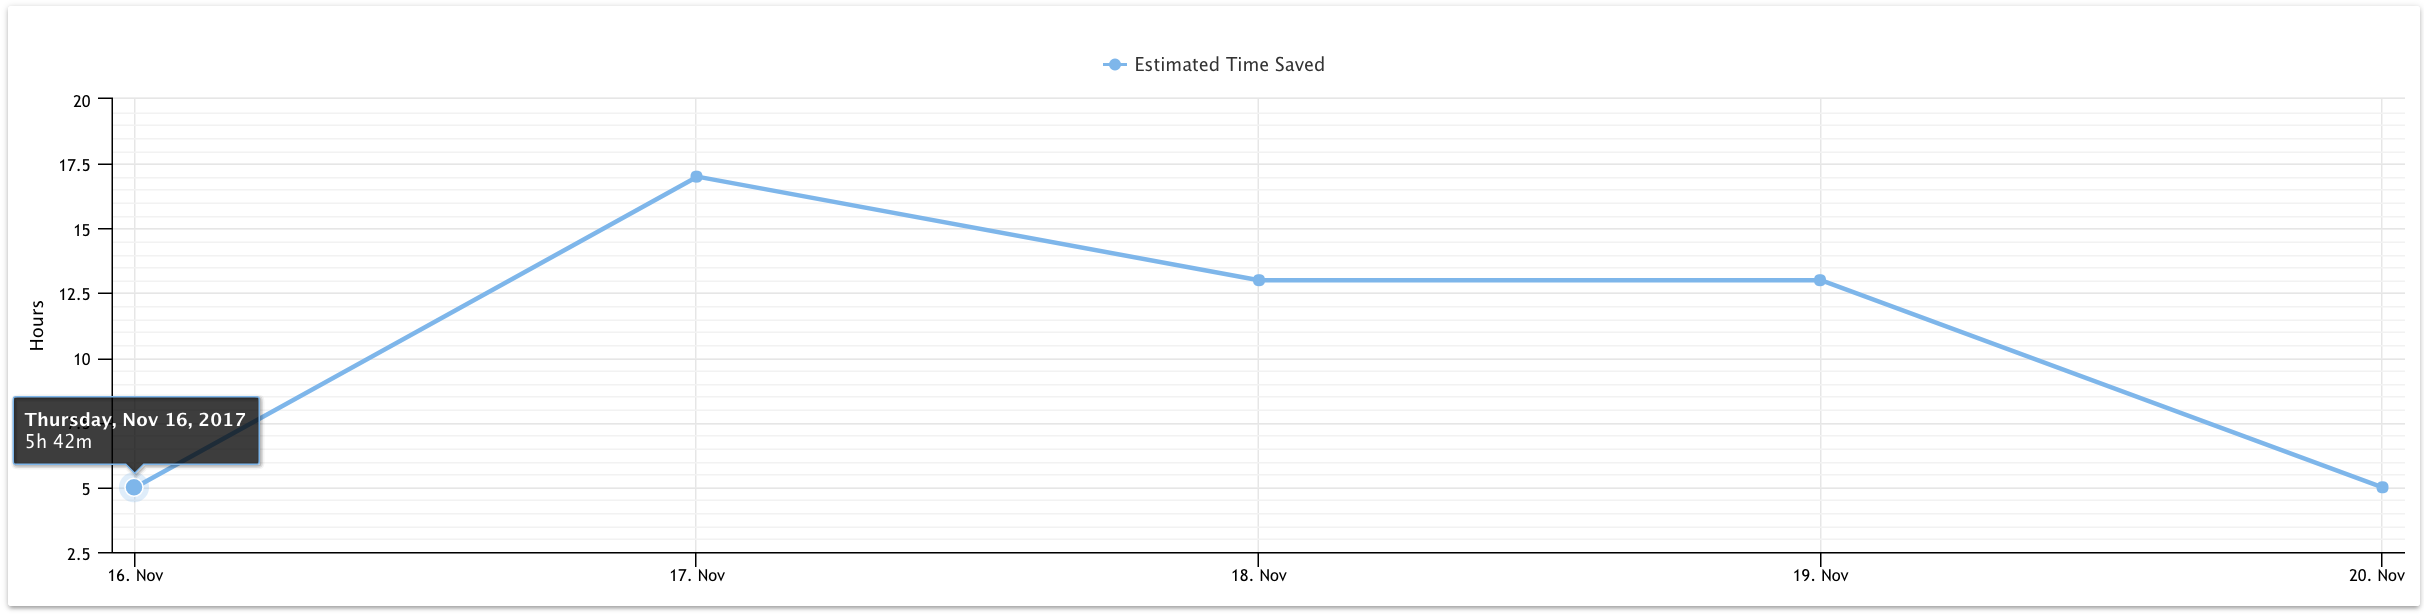
This area shows a graphic representation of each of the KPIs over time. The Time Saved graph is displayed automatically upon opening the page. You can display the graph for each of the KPIs by clicking on the KPI title.
-
The data displayed in the graph is aggregated daily. Therefore, each point in time represents all activity that occurred during that day.
-
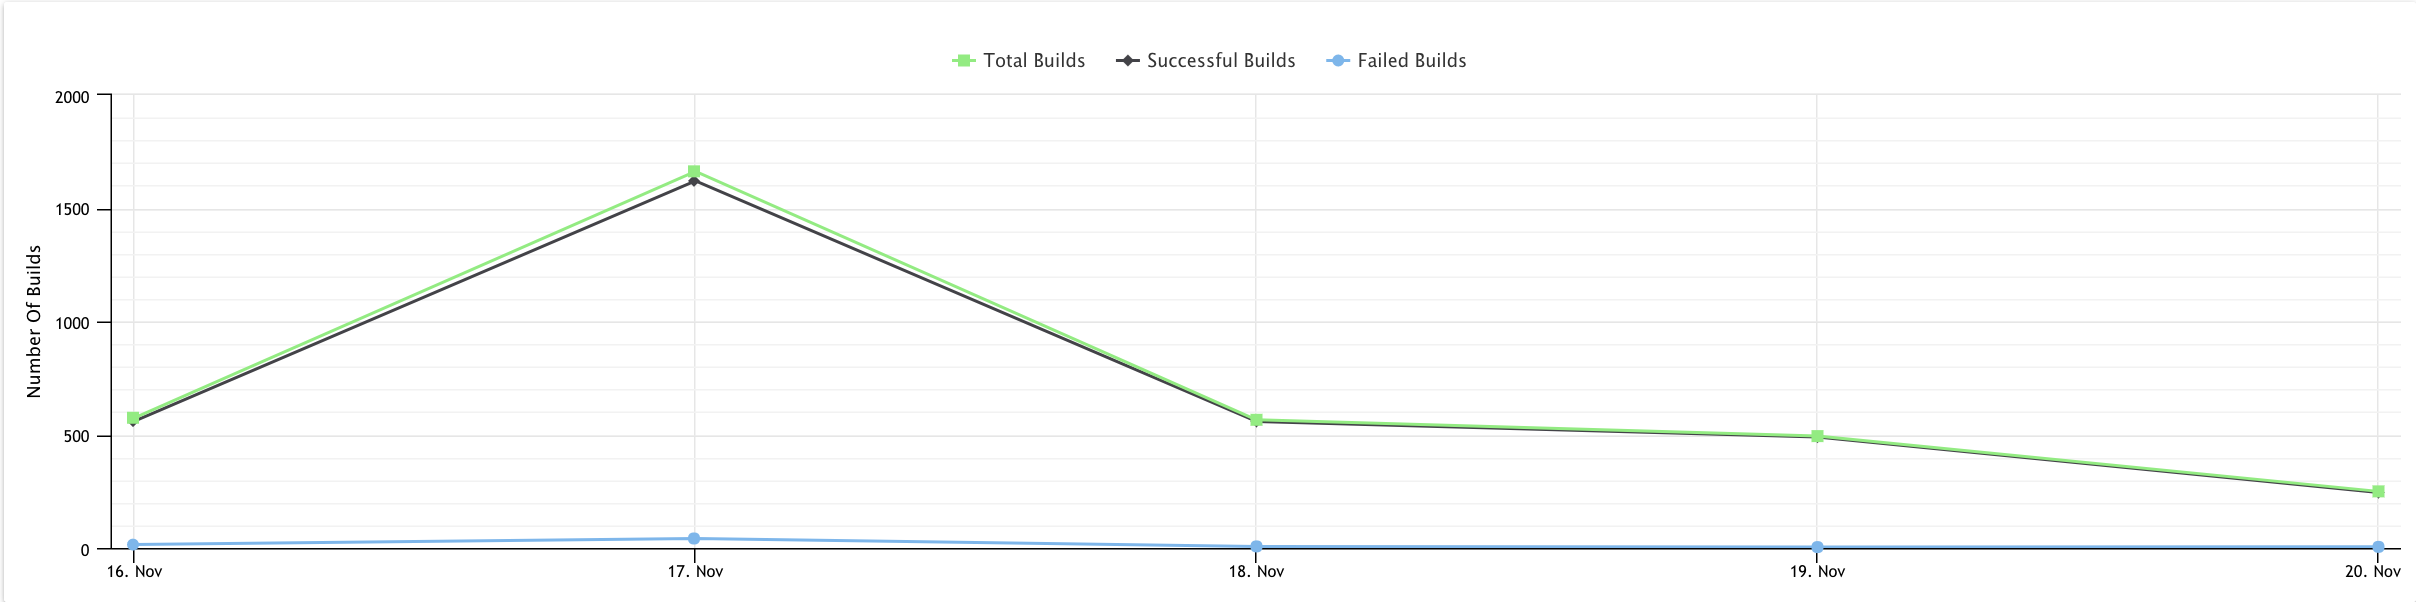
The legend indicating the color of the display for each element is shown at the top of the graph.
Below are examples of what you may see for each KPI value clicked on:
Time Saved:
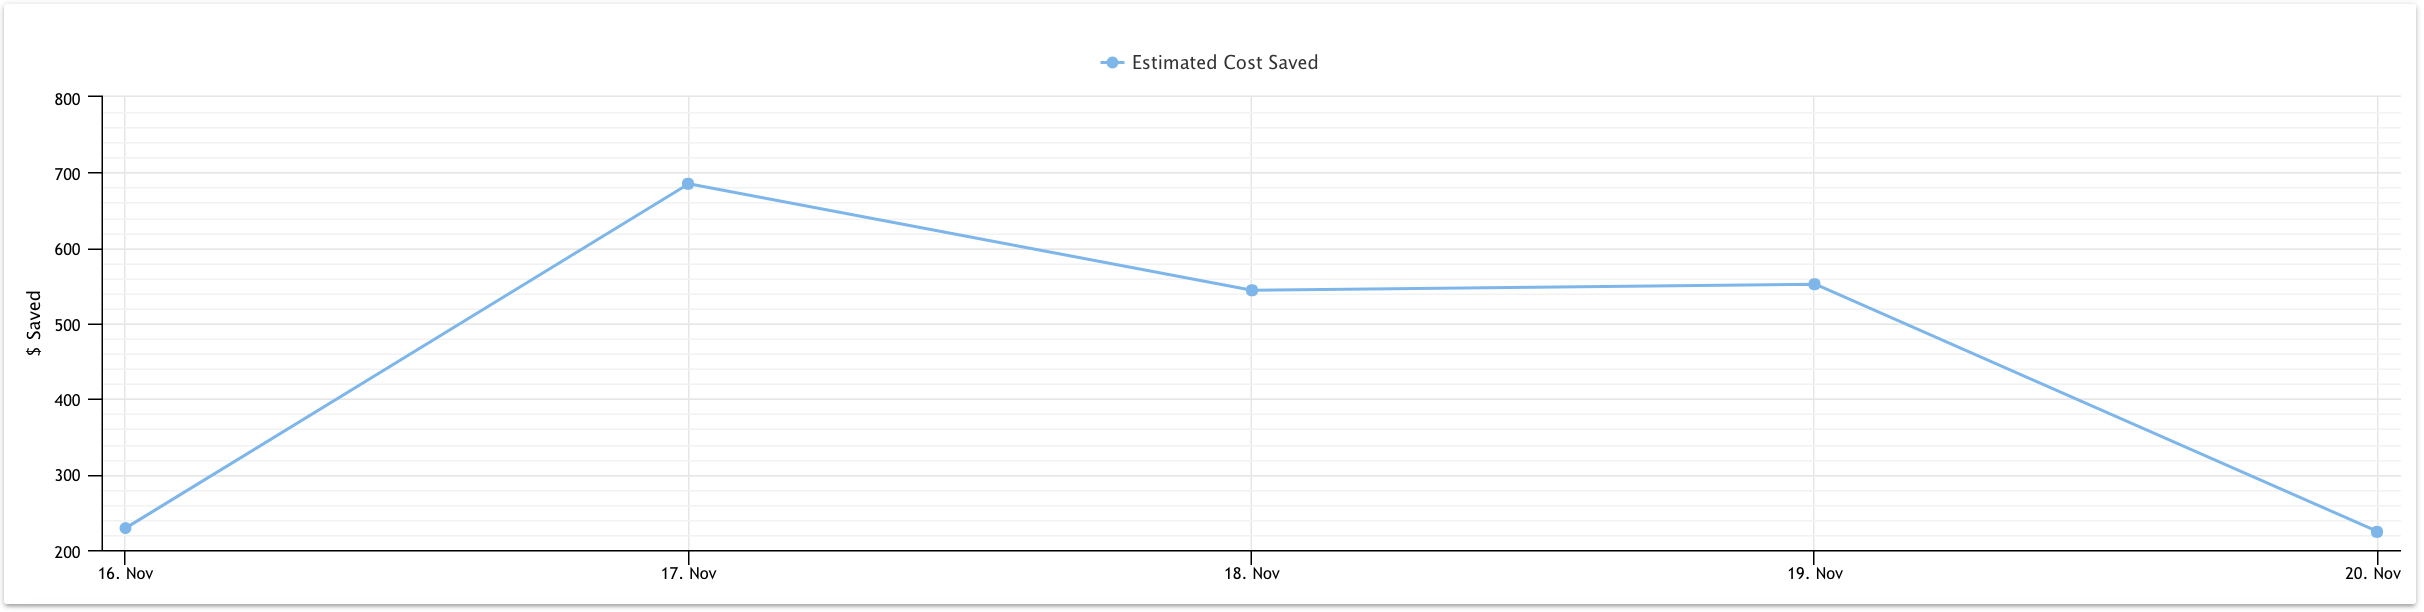
Cost Saved:
Executed Builds:
Processing Time:
You can interact with the display in the following manner:
-
Select/Deselect – Click on one of the data elements in the legend to show/hide that element in the display. The default is to display all elements. Therefore, the first time that you click on an element it will hide it.
-
Display data – Hover over a point in the graph to create a pop-out display of the specified date and time and the data for that particular point in time.
-
Zooming – Drag the cursor over a section of the timeline to zoom in on that time range and display a more granular breakdown of the data over a shorter period of time. To return to the display of the full timeline, click the Reset Zoom button in the top right corner of the graph.
Available Agents and Cores
This area shows information about availability of cores and Agents during the previous hour. This data is updated on the hour. Therefore, the data for the last hour for which the information is aggregated is displayed (i.e. at 10:45 AM it may show the data for the period from 9:20 AM to 10:20 AM).
These pie charts show information regarding availability of both cores and Agents over the course of an hour. This data is updated hourly. The exact time on which an hours of aggregation starts depends on when your Incredibuild Coordinator started.
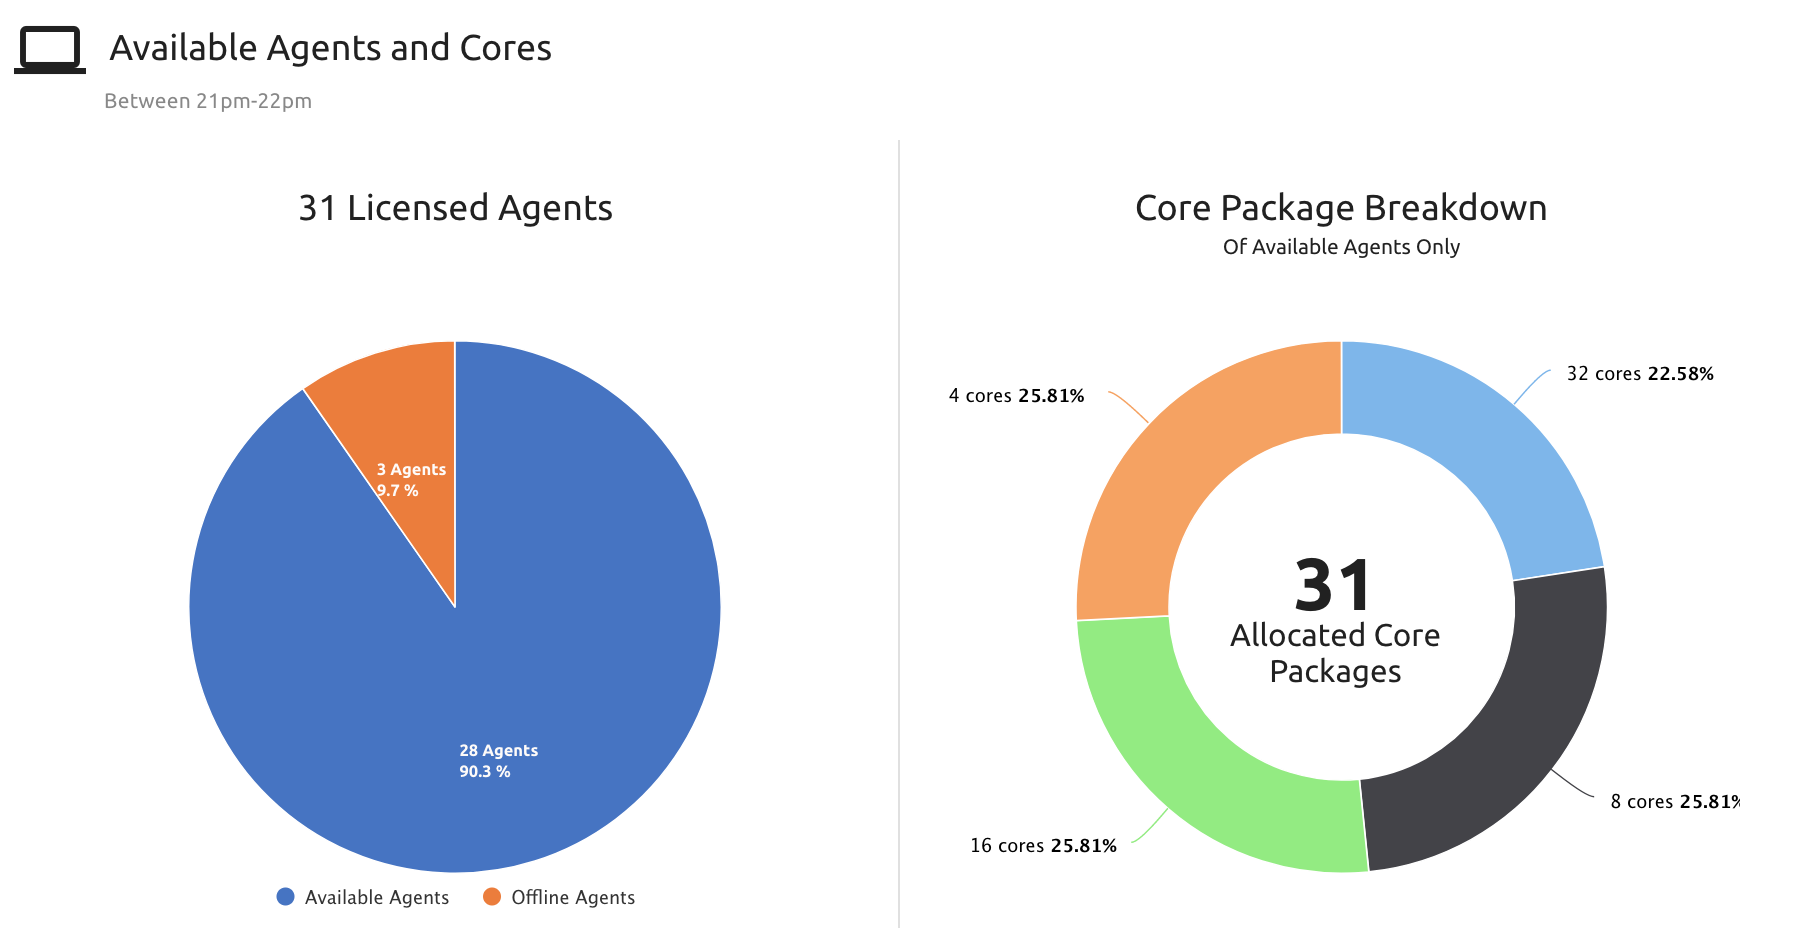
Licensed Agents Chart
This pie chart indicates the availability of Agents during the previous hour for which data was aggregated. The information displayed in this pane is described in the following table.
|
Item |
Description |
|---|---|
|
Licensed Agents |
The total number of Agents that are licensed for use in your Incredibuild infrastructure. |
|
Offline Agents |
The number and percentage of the licensed Agents that were not connected to the Coordinator during the past hour. Only an Agent that was offline for the entire duration of the previous hour is considered offline. |
|
Available Agents |
The number and percentage of the licensed Agents that were connected to the Coordinator and subscribed for any part of the previous hour. |
Core Package Breakdown Chart
An Incredibuild license contains various core packages that can be allocated to Agents. Agents are assigned with a specific core package, usually according to the number of logical cores the hardware hosting the Incredibuild Agent has. This pane shows a doughnut chart indicating the breakdown of the different types of Core Packages as well as the number of core packages that are allocated. The information in this chart refers only to Agents that are available (i.e. licensed and connected to the Incredibuild Coordinator).
The information displayed in this pane is described in the following table.
| Item |
Description |
|---|---|
|
Core Package Chart |
The doughnut chart shows the number of Core Packages of each type that have been assigned to Available Agents on the network. It also shows the percentage of that type of Core Packages out of the total number of core packages |
|
Allocated Core Packages |
The total number of core packages assigned to available Agents. If for example,you have 4 available Agents in your Incredibuild infrastructure, each assigned with an 8-cores package, this value will be 4. |
Current State
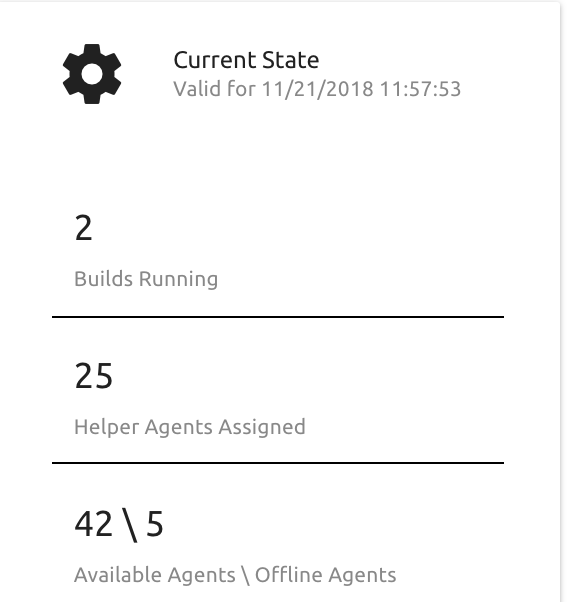
This pane shows basic information about the current state of the Incredibuild infrastructure. The data displayed in this pane is updated in the database every 5 seconds but in order to see the latest values you'll need to refresh this page. The information displayed in this pane is described in the following table.
|
Item |
Description |
|---|---|
|
Builds Running |
The number of builds currently running using Incredibuild. |
|
Helper Agents Assigned |
The number of Helper Agents currently being used by Incredibuild. |
|
Available Agents |
The number of Agents currently connected to the Coordinator and available for use by Incredibuild. |
|
Offline Agents |
The number of Agents which are subscribed to the Incredibuild Coordinator but are not currently connected to the Coordinator. |
License Details
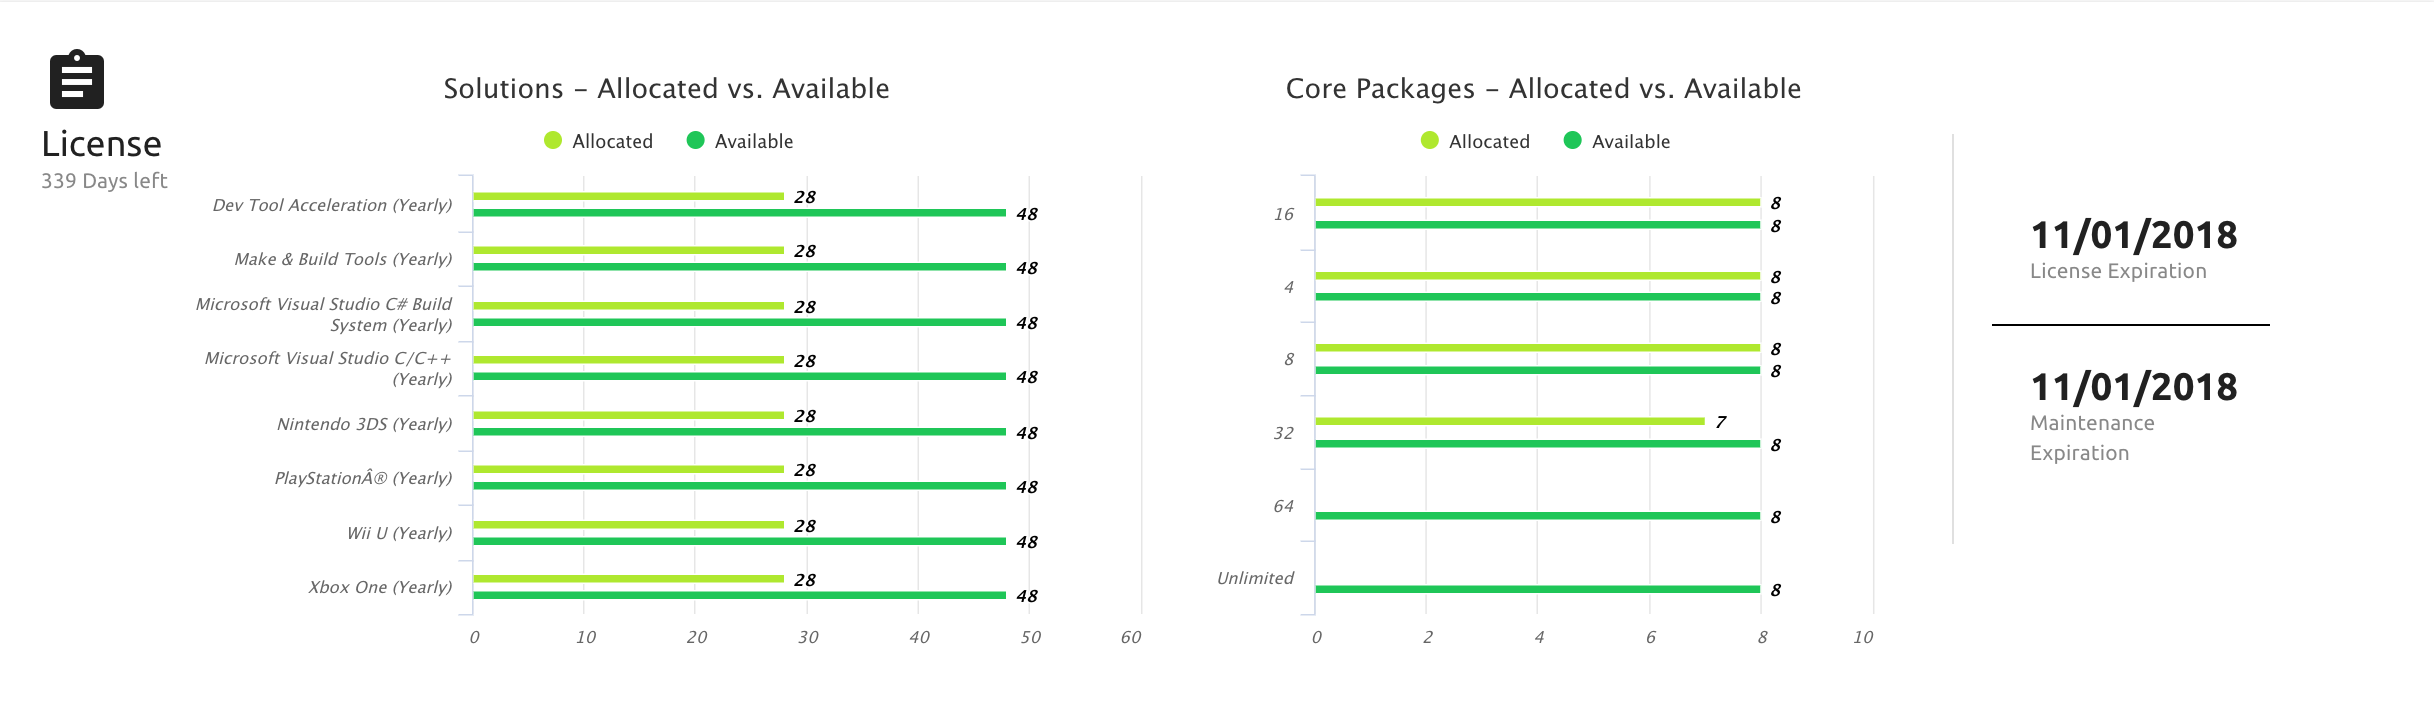
This area shows information about your Incredibuild license.
-
The legend indicating the color of the display for each element is shown at the top of each graph.
-
The number of days remaining before the license expires is displayed in red below the heading.
Solutions Pane
This pane shows a bar graph with information about the breakdown of Solutions type. The bars next to each Solution type show the total number of solutions available for each solution type and the number of Solutions that have been allocated to Incredibuild Agents.
Core Packages Pane
This pane shows a bar graph with information about the breakdown of Cores Packages. The bars next to each Core Package type (e.g. 8 core, 16 core etc.) show the total number of Core Packages available for each Core Package type and the number of Core Packages that have been allocated to Incredibuild Agents.
Expiration Pane
This pane shows the expiration dates for your license and maintenance contract.
-
License Expiration - Once your license has expired you will no longer be able to use Incredibuild.
-
Maintenance Expiration - Once your maintenance contract has expired you will no longer be able to receive support form Incredibuild or upgrade to newer versions of the product.