Helpers Resource Utilization Graphs
Incredibuild Enterprise Edition allows users to view detailed graphs in the Incredibuild build monitor representing the resource consumption of each process while it’s being executed on Helper machines. This feature is highly beneficial when users require to research the resource consumption of processes when being executed on various Helper machines.
In order to be able to view these graphs, users should:
- Have a valid Incredibuild Enterprise license loaded on the Coordinator machine.
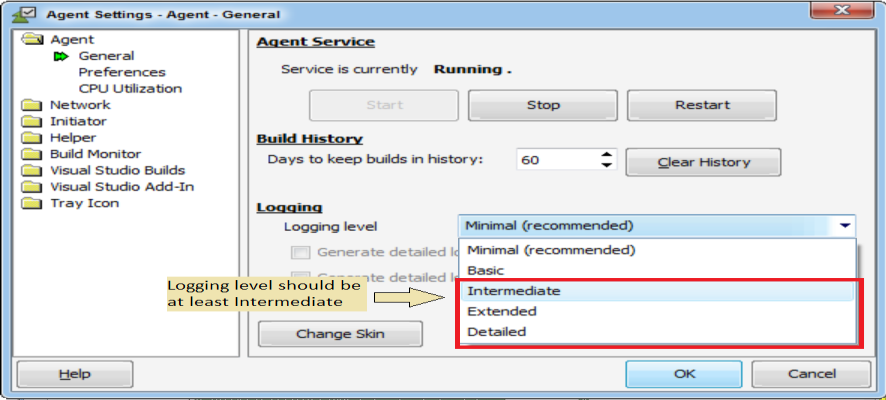
- Increase the Incredibuild logging level to at least “Intermediate” under the Incredibuild Agent Settings -> Agent -> General -> Logging level (it is highly recommended to decrease the logging level back to minimal after the research is completed, as logging level which is higher than minimal has some negative impact on performance).
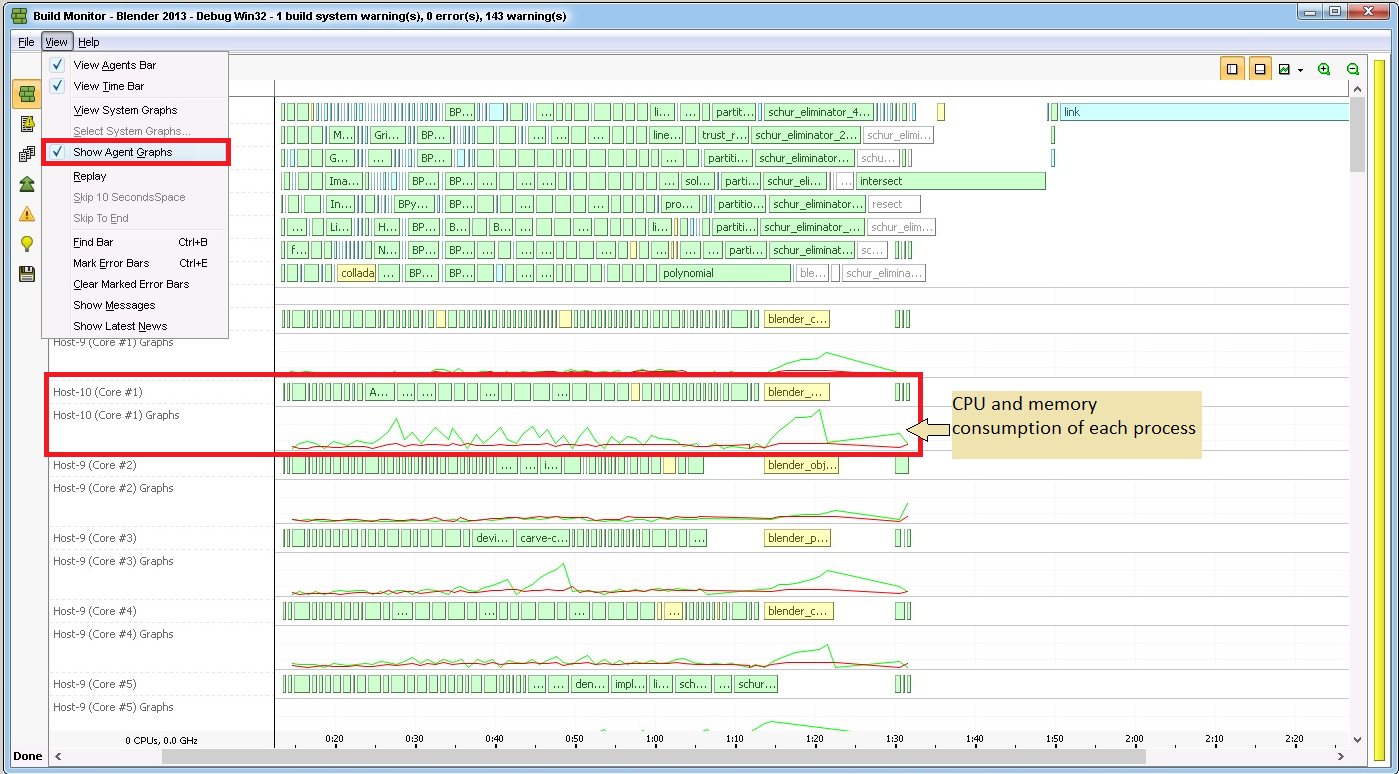
- In the Incredibuild build monitor, check the “Show Agent Graphs” option under the “View” menu item.
Figure 2: Incredibuild Agent Settings logging level options
Figure 3: Showing Helper graphs in the Incredibuild build monitor
The Helpers resource utilization graphs are displayed per utilized Helper core. The available graphs are:
CPU graph – this graph represents the CPU consumption of the process currently being executed on a specific Helper core. If a Helper machine has 4 cores and a process executing on a specific core shows that it utilizes 25% CPU, it means that this process is using 100% of a single core out of the 4 cores available on this machine.CPU of this core, the value on the graph will show 25%, meaning that this process takes 25% of the overall CPU resources available on this machine.
Commit Charge graph – this graph represents the memory consumption of a process while executing on a Helper machine.

