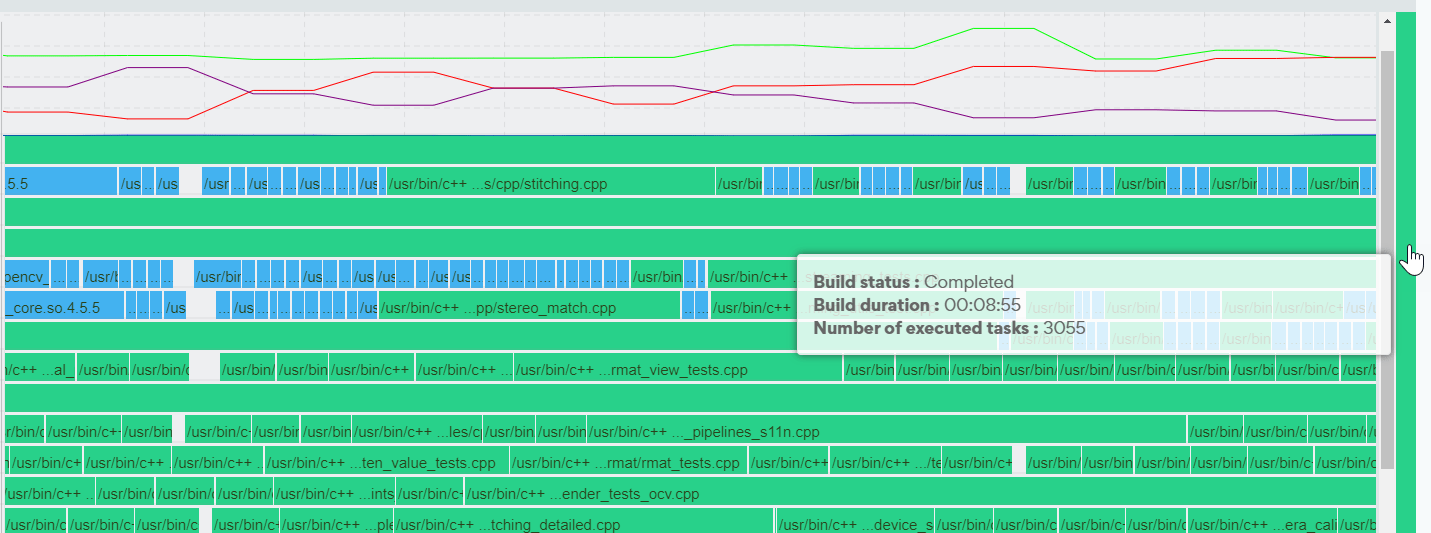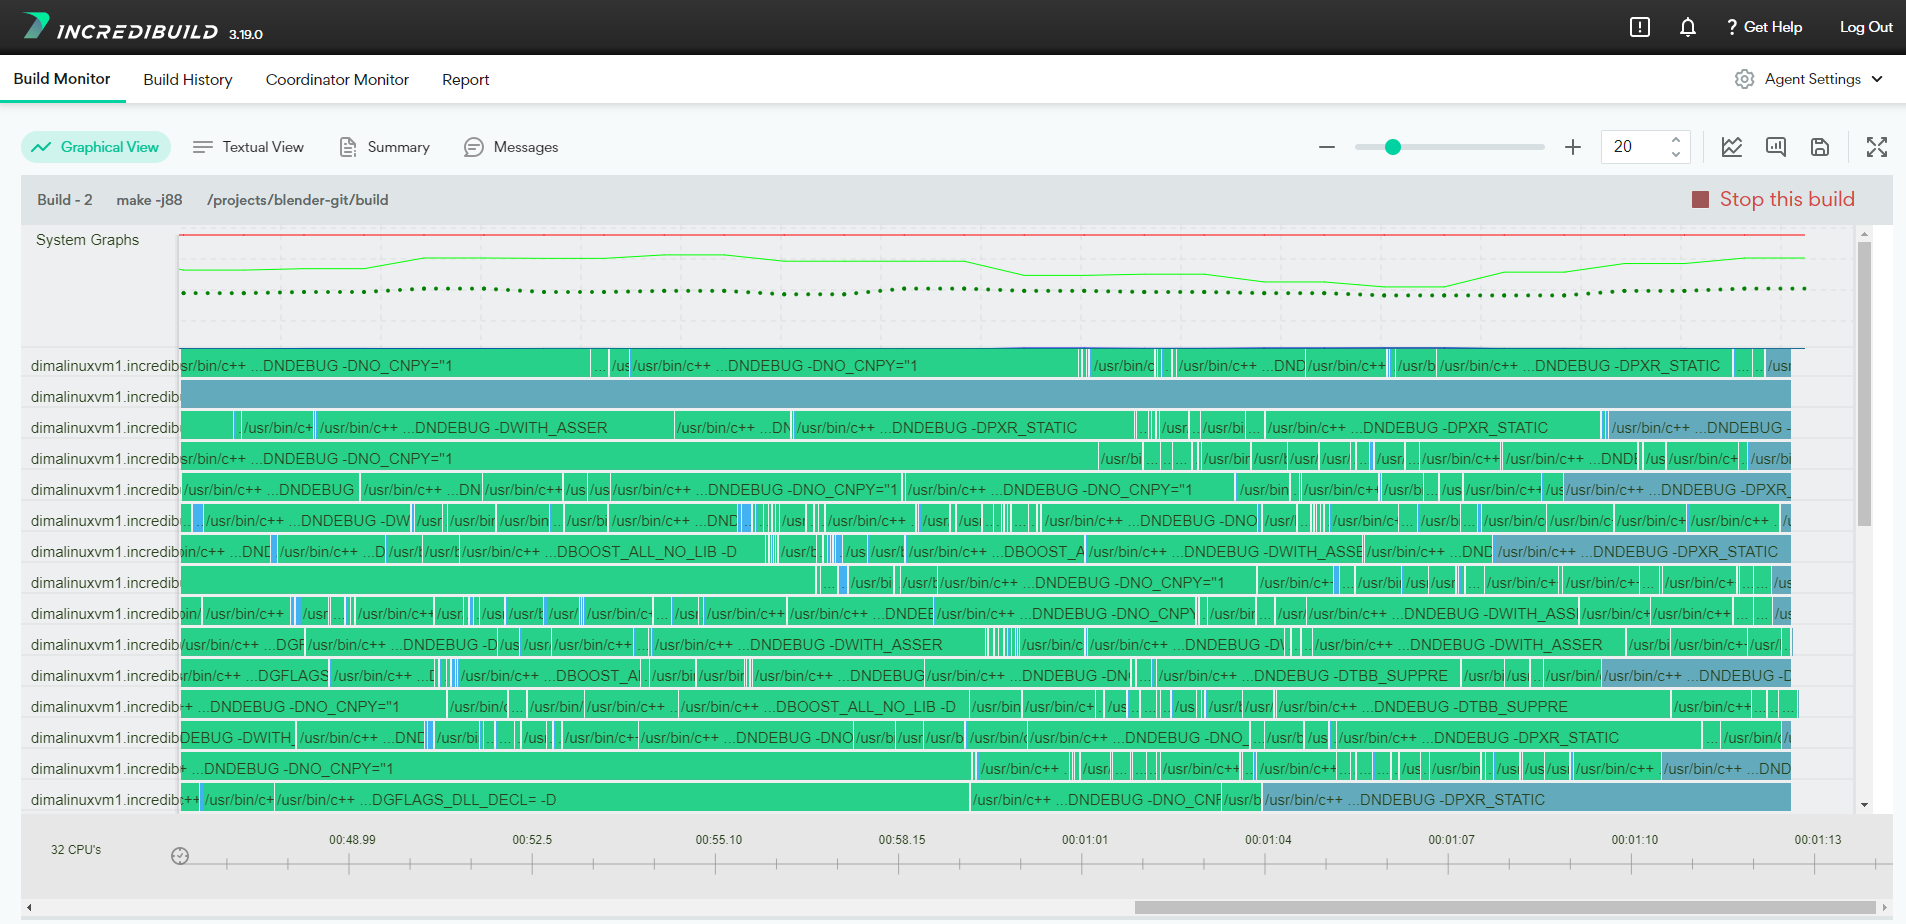
- System Graphs - top pane
- Build Monitor Graph - bottom pane

Build Monitor Graph
The Build Monitor Graph illustrates how tasks are distributed between the Agent machines (CPUs) over time. The time axis displayed below the graph is the time that has elapsed from the beginning of the build. Clicking the clock icon on left side of the time axis will toggle between relative time and absolute time. The Build Monitor Graph provides developers with the ability to have an intuitive graphical representation of their execution process, quickly locate errors and warnings, see the execution duration of each task, find performance bottleneck and retrieve detailed information on every task that is executed as part of the build process. Hovering on a task block displays the process ID, name, task ID, and exit code of the process.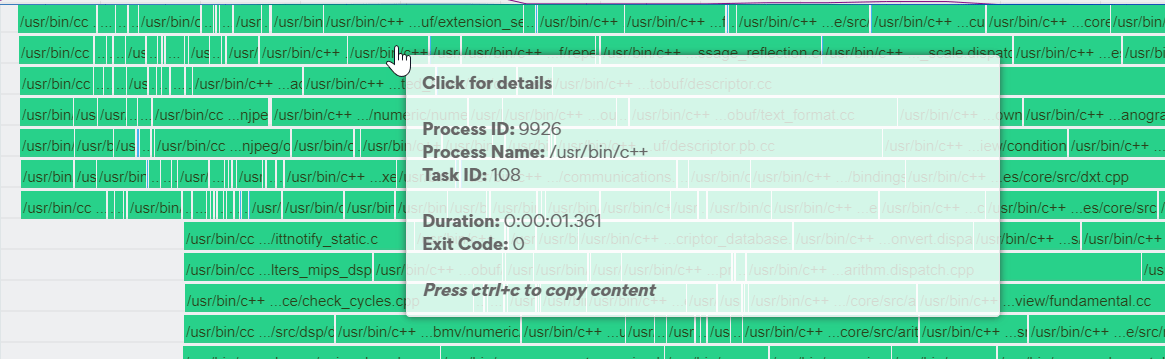
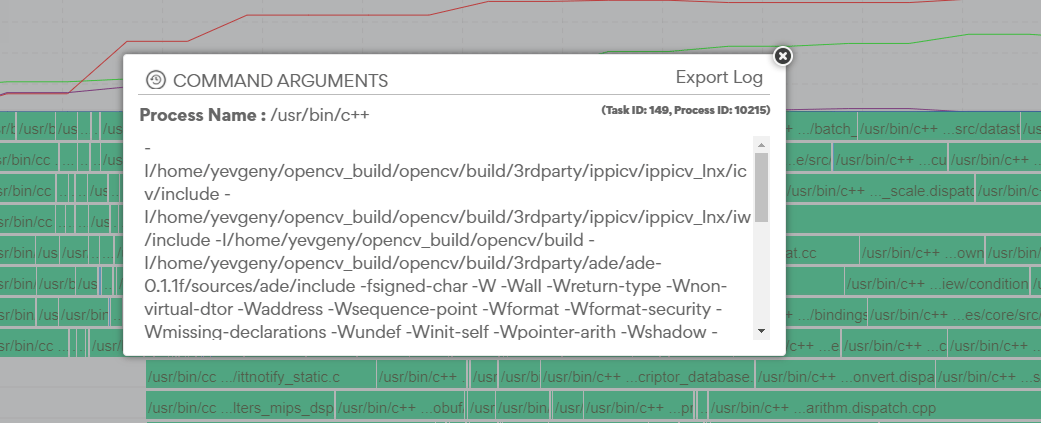
-

-

-

-

-

-

- Green - Build completed successfully, without warnings.
- Yellow - Build completed successfully, with warnings.
- Red - Build failed or was aborted.