

Opening the Build Monitor
The Build Monitor is automatically opened when starting a build from the Visual Studio IDE or from the Agent Tray Icon. It can also be opened by:- Selecting “Open Monitor” from the Incredibuild menu in the Visual Studio IDE.
- Double-clicking the Incredibuild tray-icon.
- Using the /OPENMONITOR command line console (BuildConsole and IBConsole).
Display Icons and Their Meanings
| Icon | Description |
|---|---|
 | Progress display a visual representation of the distributed build process. |
 | Output display shows the entire build’s output text, similar to what would have been generated by Microsoft Visual Studio C++ builds. |
 | Projects display relevant only for Microsoft Visual Studio C++ builds; shows for each project/configuration built, the standard output from the executed tools, including warning and error messages. |
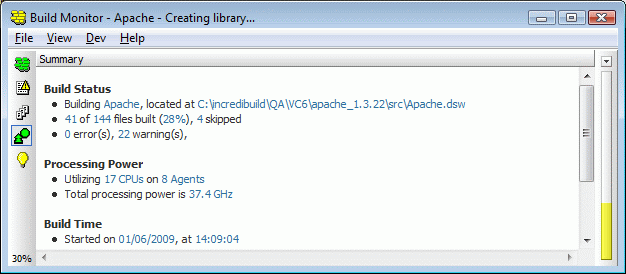
 | Summary display contains information and statistics on the current build. |
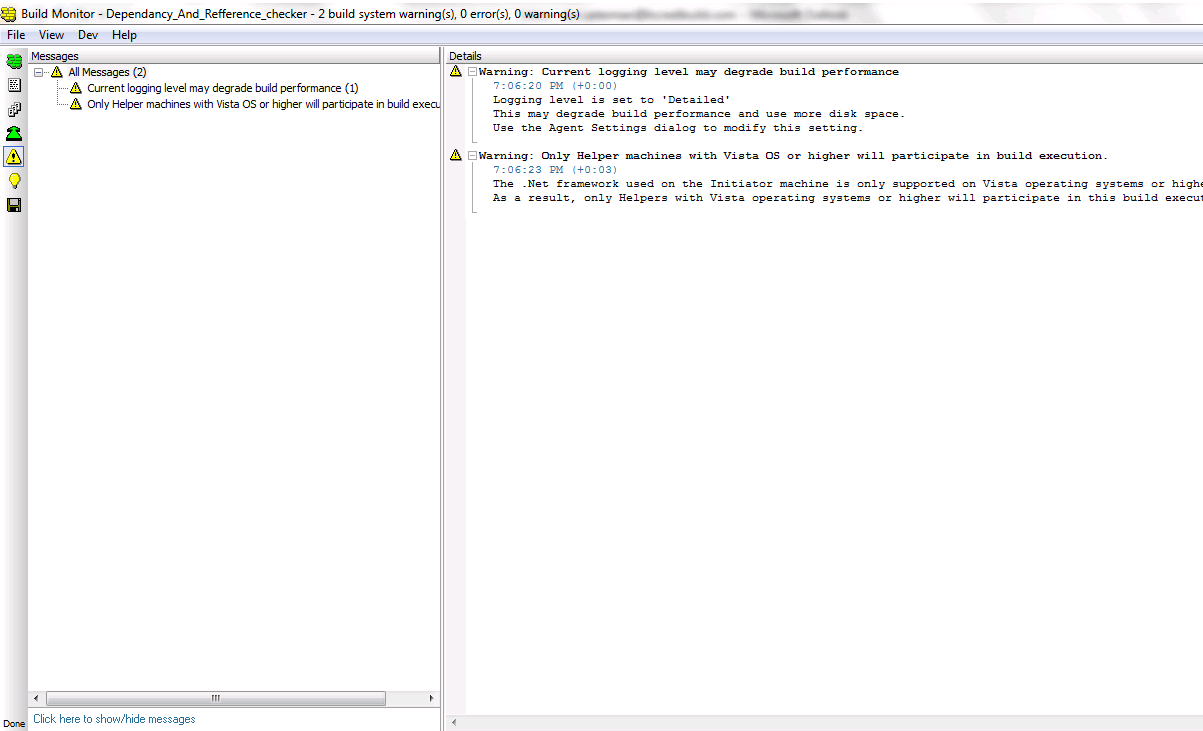
 | Warning display displays warnings that are part of the execution; appears only if there are warnings. |
 | Did You Know? contains useful tips for making the most out of Incredibuild. |
The Build Display Options
The following sections describe the different build displays that can be selected by clicking the relevant icons in the vertical menu on the left-hand side of the Build Monitor:The Progress Display
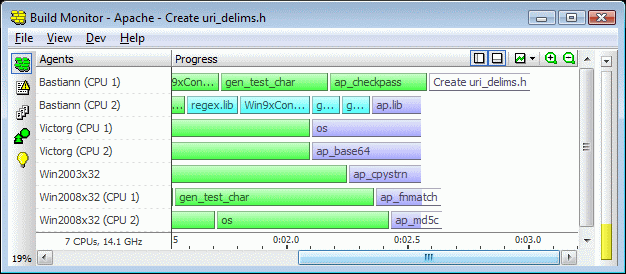
Hovering the mouse pointer over a colored bar displays the elapsed time until that point in the build, as well as any additional information available regarding that file. The display can also be panned to all directions (click and drag mouse) and zoomed in and out (CTRL/SHIFT+mouse click).
A context menu is displayed when right-clicking a progress bar. This menu offers the following options:
The following two options, useful for troubleshooting, are available when right-clicking a bar, provided that the logging level is detailed:
- Save Detailed Log…–Saves a log file that can be sent to Incredibuild Support to analyze the executed process’s execution.
- View Process Activity–Opens a viewer showing information for tracing execution of a remotely run process. The viewer shows stdout and stderr output for the executed process and its subprocesses, as well as PID information and environment blocks.
- In Visual Studio builds and Make and Build tools, double-clicking a bar automatically opens the output of the task that is currently running.
- If double-clicking a bar does not work well in a build run using either the Submission Interface or Automatic Interception Interface, this can usually be resolved using the IdentifyTaskOutput keyword.
The Output Display
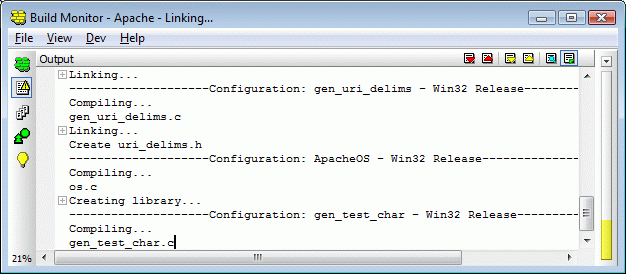
The Projects display supports this same list of features.
Note:
- In Visual Studio, as Incredibuild often builds more than one project at a time, some buffering of the build output is performed to ensure that the output of different configurations do not mix. This behavior may result in files not being shown in the Output display despite having already been built. To view build output for all files, use the Projects Display.
The Projects Display
The Projects Display is only relevant for Visual Studio builds.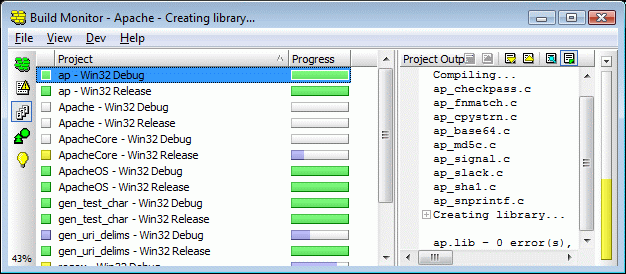
The Summary Display
The Warning Display
System Graphs
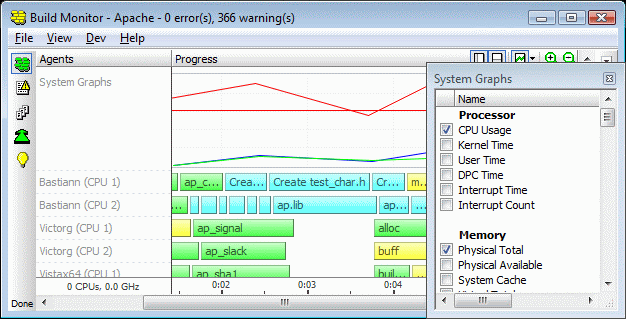
- Right-click the display and select View system graphs.The graphs display opens, showing currently selected graphs.Hovering the mouse cursor over a graph displays values for currently displayed graphs at the selected point in time.
- Right-click the display and select Select system graphs….A window allowing control of the system parameters and their corresponding graph color is displayed.
Cool Monitor Features
From the Build Monitor, you can do the following:- View the output distribution of any project, by double-clicking a bar in the Projects display.
- Jump to the first warning or error in the build output, by double-clicking a yellow or red status bar.
- Choose the way the status bar calculation handles files that were skipped during the build (count them as completed or disregard them altogether), by clicking the small down-arrow icon located just above the status bar.