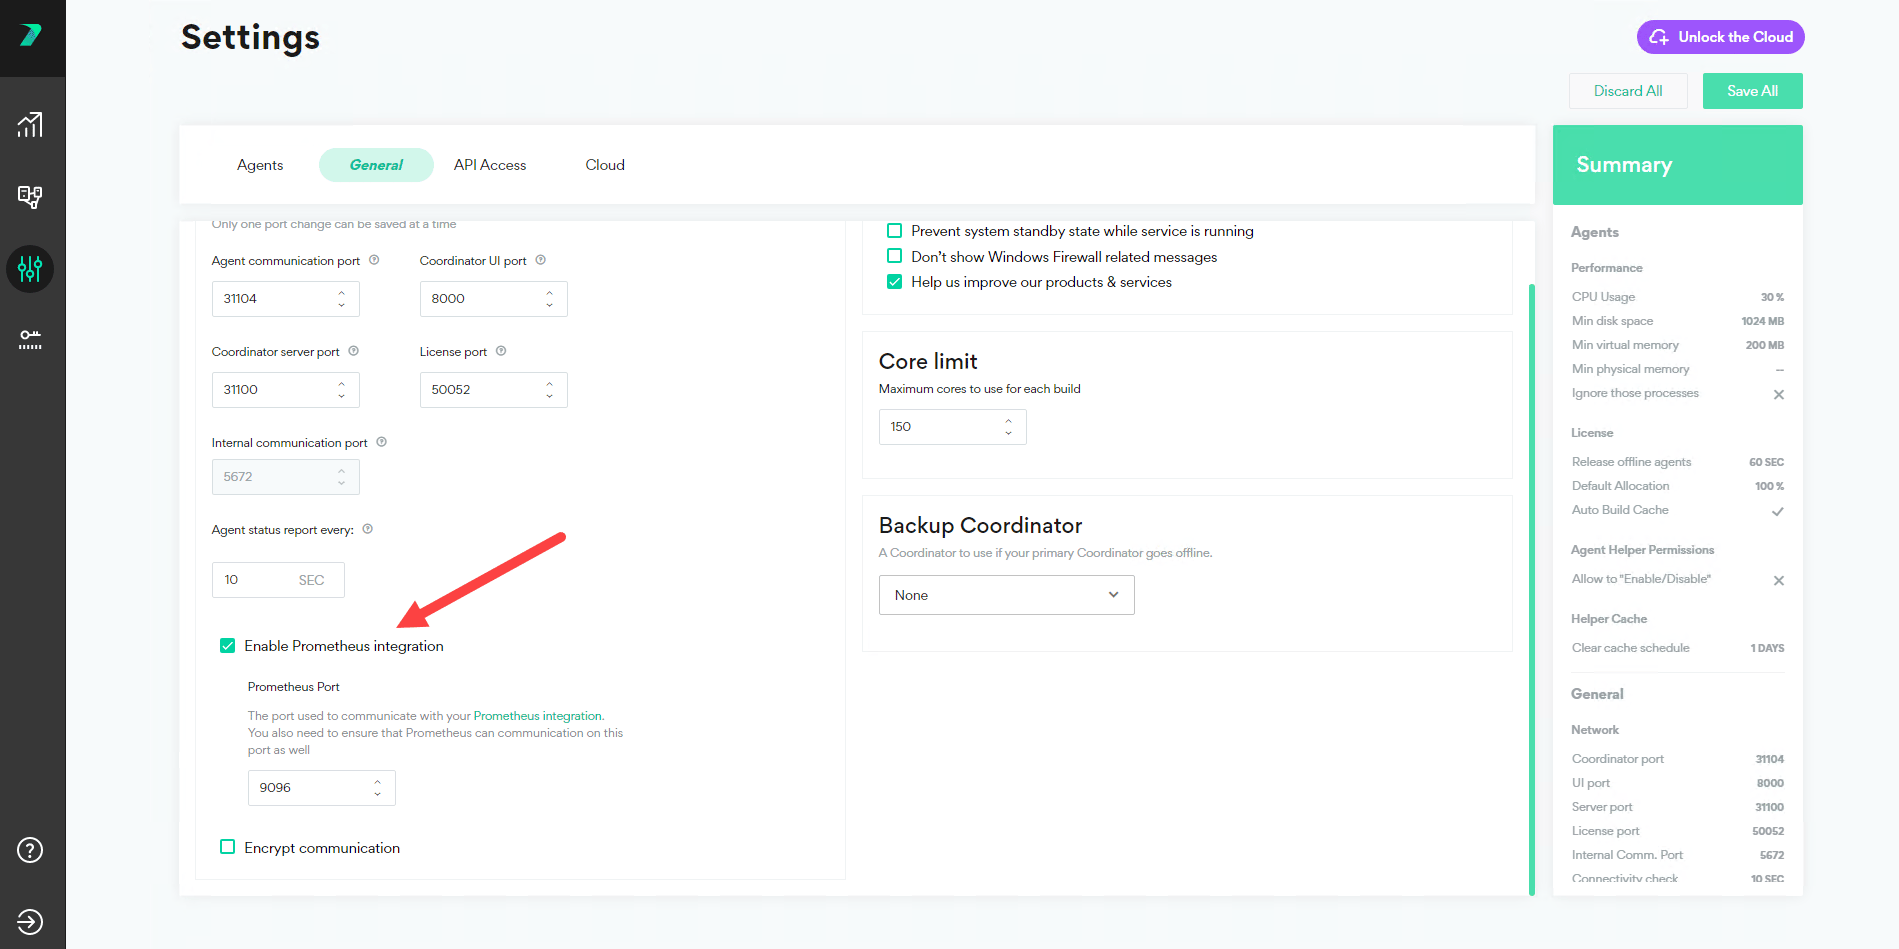
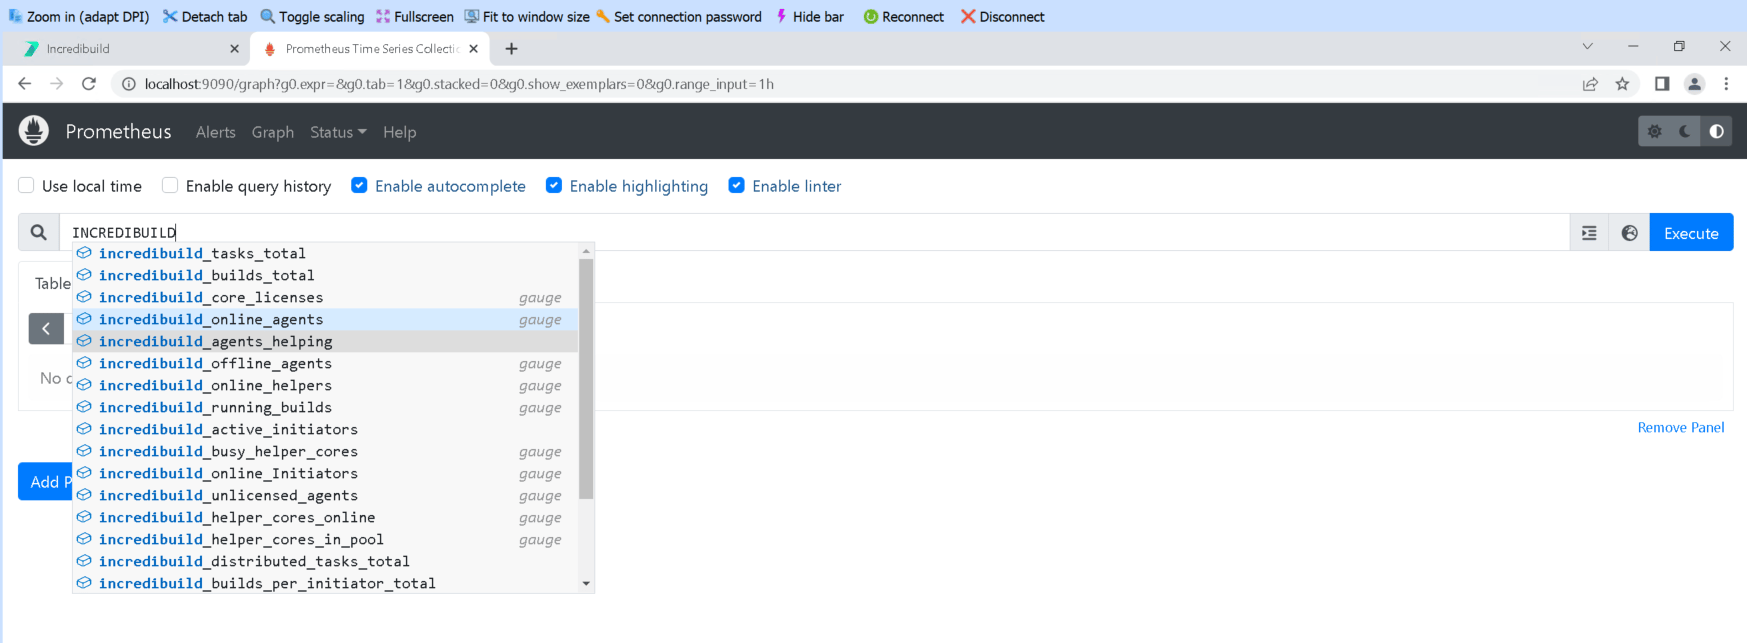
| Total number of completed builds | Counter | incredibuild_builds_total | coord_name, build_group, initiator_type, ended_successfully | This includes builds that failed as well as those that completed successfully. |
| Total number of builds broken down by initiator | Counter | incredibuild_builds_per_initiator_total | initiator_name, ended_successfully | |
| Total run time (seconds) of all successful builds | Counter | incredibuild_successful_builds_seconds_total | coord_name, build_group, initiator_type, distributed_to_helpers | |
| Total number of executed tasks | Counter | incredibuild_tasks_total | coord_name, build_group, initiator_type, distributed_to_helpers | |
| Total number of tasks distributed to a helper | Counter | incredibuild_distributed_tasks_total | coord_name, build_group, initiator_type | |
| The number of Initiators currently initiating a build | Gauge | incredibuild_active_initiators | coord_name, build_group, initiator_type | |
| The number of builds currently running | Gauge | incredibuild_running_builds | coord_name, build_group, initiator_type | |
| The number of helper cores that are currently busy | Gauge | incredibuild_busy_helper_cores | coord_name, build_group, helper_type | |
| The number of helper core licenses in your account | Gauge | incredibuild_core_licenses | coord_name | Includes both fixed and floating |
| The number of helper cores that currently have been assigned a fixed or floating license | Gauge | incredibuild_helper_cores_in_pool | coord_name, build_group | |
| The number of helper cores currently online | Gauge | incredibuild_helper_cores_online | coord_name, build_group | Only includes helpers that are enabled as helpers, online, and have a license. |
| The total number of successful builds broken down in a histogram | Histogram | incredibuild_builds_seconds_histogram | coord_name, build, build_group | Broken down into 0-1 seconds, up to 10 seconds, up to 60 seconds, up to 30060-300, 301-600, 601-1200, 1201-1800. |
| The number of helper agents currently helping in a build | Gauge | incredibuild_agents_helping | coord_name, build_group, helper_type | Does not include helper agents assisting initiators on the same machine. |
| The current number of disabled helper cores with a license | Gauge | incredibuild_disabled_helpers_with_license | coord_name, build_group | |
| The number of agents currently online | Gauge | incredibuild_online_agents | coord_name, build_group | Includes helper and initiator agents |
| The number of agents currently offline | Gauge | incredibuild_offline_agents | coord_name, build_group | Includes helper and initiator agents |
| The number of agents without any license | Gauge | incredibuild_unlicensed_agents | coord_name, build_group | Agents without initiator or helper license (called local in UI) |
| The number of helper agents currently online | Gauge | incredibuild_online_helpers | coord_name, build_group | Only includes helpers that are enabled as helpers, online, and have a license. |
| The number of initiator agents currently online | Gauge | incredibuild_online_initiators | coord_name, build_group, initiator_type | |
| The number of helper cores currently needed across your grid | Gauge | incredibuild_needed_helpers | coord_name, build_group | Only includes helper cores that meet all requirements to act as helpers (includes both helper cores currently helping and those who are ready to be assigned to help) |
| The number of helpers currently available across your grid | Gauge | incredibuild_available_helpers | coord_name, build_group | |
| The total number of build seconds in the given timeframe | Counter | incredibuild_builds_seconds_histogram_sum | coord_name, build_group | Note only successful builds are counted and summarized. |
| The number of builds counted in the given timeframe | Counter | incredibuild_builds_seconds_histogram_count | coord_name, build_group | Note only successful builds are counted and summarized. |
| The count of builds counted across different build duration ranges | Histogram | incredibuild_builds_seconds_histogram_bucket | coord_name, build_group | The build duration ranges: 0-1 sec, up to 10 sec, up to 60 sec, up to 300 sec, up to 600 sec, up to 1200 sec, up to 1800 sec, up to 2700 sec, up to 3600 sec, up to 7200 sec, up to 14400 sec, more than 14400 sec. |