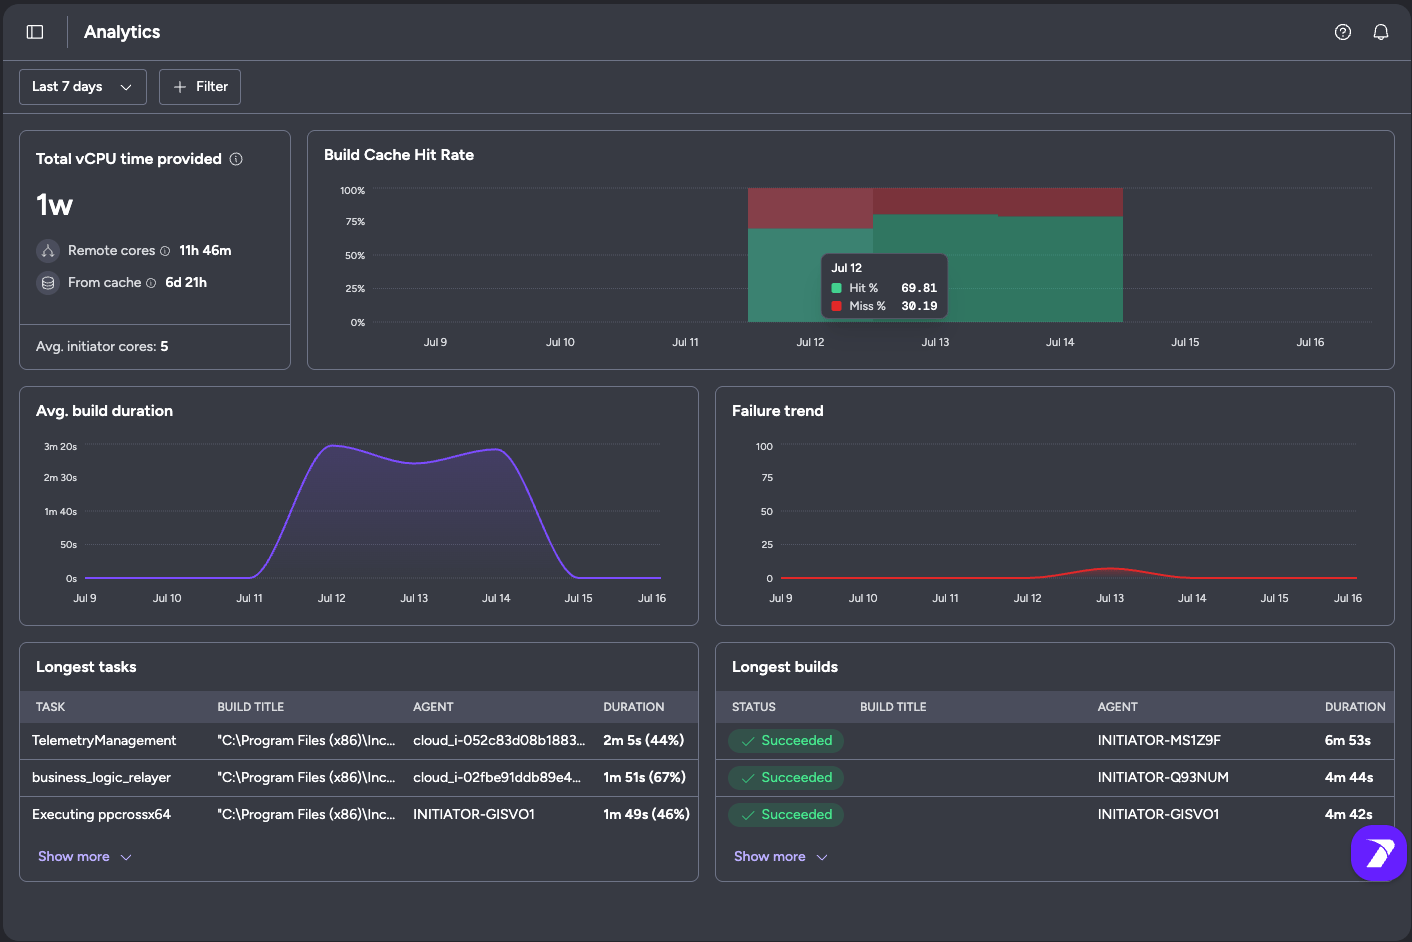
The Analytics page gives an aggregate view of your builds over time - cache efficiency, build duration, failures, compute time provided, and your longest tasks and builds.
Analytics page with vCPU time, cache hit rate, build duration, failure trend, and longest tasks and builds

Total vCPU time provided

The total compute time Incredibuild provided through distributed processing and cached results, measured in virtual CPU hours. It breaks down into:
  • Remote cores - processing time distributed to remote agents in your network.
  • From cache - processing time saved by reusing previously computed results from Build Cache.
  • Avg. initiator cores - the average number of cores on your initiating machines.

Build Cache Hit Rate

How much cacheable work was served from cache over time - Hit % (green) versus Miss % (red).

Avg. build duration

The average build duration over time.

Failure trend

The build failure rate over time. The tooltip shows the failed-vs-total build counts behind each point.

Longest tasks

The tasks that consumed the most time - with the task, its build, the agent that ran it, and how long it took (including its share of the build’s total duration).

Longest builds

Your longest-running builds - with status, build title, initiator, and total duration.